Cerca de 60% da população da zona oeste de Odivelas está a mais de 20 minutos de uma estação de metro ou de comboio. Por outro lado, a Linha de Sintra é um caso de sucesso, alinhando-se quase perfeitamente com o grau de urbanização no seu percurso.

A mobilidade na Área Metropolitana de Lisboa (AML) está continuamente em debate no espaço público e também político. Com este trabalho de análise, pretendo contribuir para essa discussão com dados. Procurei as áreas de maior densidade residencial da AML e onde se demora demasiado tempo a pé até uma estação de metro ou comboio.
Estas foram algumas das conclusões que obtive:
- Tirando Belém e Ajuda, as freguesias do município de Lisboa têm a maioria das suas populações servidas por estações de comboio ou metro;
- O mesmo já não acontece com outras zonas da AML, incluindo algumas áreas com densidades populacionais semelhantes às das freguesias de Lisboa;
- O caso mais flagrante nesse aspecto é aquele a que chamei de “Odivelas Oeste”, onde vivem mais de 200 mil pessoas, das quais cerca de 60% vivem a mais de 20 minutos de uma estação de metro ou comboio;
- Por outro lado, há casos de sucesso como o da Linha de Sintra, que se alinha quase perfeitamente com o grau de urbanização no seu percurso – provavelmente porque já lá existia à medida que se foram construindo as habitações. É um bom exemplo de “desenvolvimento orientado pelo transporte público”.
Nota: este artigo tem vários mapas interactivos que podem demorar a carregar em algumas situações, dependendo da qualidade da tua conectividade à internet.
Índice
Parte 1 – Introdução
Porquê só comboio e metro?
Não é por acaso que tantas cidades de média ou grande dimensão apostam em comboios, elétricos de superfície, ou metropolitano subterrâneo. A tabela em baixo apresenta o número máximo de pessoas que passam por hora numa faixa de 3 metros de largura, usando números retirados da página 14 do Global Street Design Guide.
| Tipo de faixa (largura: 3 metros) | Pessoas por hora |
|---|---|
| Automóveis privados | 600 – 1 600 |
| Automóveis privados e autocarros frequentes | 1 000 – 2 800 |
| Ciclovia bidirecional | 6 500 – 7 500 |
| Autocarros em faixas BUS | 4 000 – 8 000 |
| Pessoas a pé no passeio | 8 000 – 9 000 |
| Metro ligeiro de superfície ou BRT/Metrobus | 10 000 – 25 000 |
Alguns destes números podem não ser intuitivos – por exemplo, um passeio com 3 metros de largura permite a passagem de 8 a 9 mil pessoas por hora, o que é muito superior a uma faixa apenas usada por automóveis privados (600-1600 pessoas por hora). A nossa intuição diz-nos que quanto mais rápido andamos, mais pessoas podem passar por hora, mas um carro ocupa um espaço muito maior que uma pessoa a pé. Ou seja, as pessoas a andar a pé andam mais devagar, mas podem andar muito mais próximas umas das outras.
É claro que em certas circunstâncias se justifica a menor capacidade do transporte em carro privado, por exemplo na rede de estradas nacionais e de auto-estradas. Não faz nenhum sentido pensar em substituir uma auto-estrada por passeios, porque nunca teremos 8 a 9 mil pessoas por hora interessadas em fazer Lisboa-Porto pela A1 a pé. No entanto, em meio urbano, a densidade de pessoas é maior e as velocidades médias de um automóvel são bastante mais baixas devido a cruzamentos, passadeiras, trânsito, etc. Nesse sentido, um passeio no centro de uma cidade frequentemente move mais pessoas que uma faixa para carros.
Por outro lado, segundo esta mesma tabela, o metro ligeiro de superfície consegue transportar, no mesmo espaço, cerca de 10 vezes mais pessoas por hora em comparação com uma mobilidade feita em carros privados.
Exemplos na AML
Pegando num exemplo da própria AML, a capacidade da Linha de Sintra é pelo menos de 16 mil pessoas por hora, uma vez que cada comboio desta linha tem capacidade para 1 600 passageiros e às horas de ponta chegam a circular 10 comboios por hora nessa linha por sentido, segundo o site da CP. Para se mover o mesmo número de pessoas usando automóveis privados em meio urbano, seria preciso usar 10 a 27 faixas… para cada lado!
Um outro exemplo são os comboios do Metro de Lisboa; cada comboio tem uma capacidade de cerca de 1 070 pessoas, segundo este artigo da Wikipédia – assumindo quatro carruagens não motoras e duas carruagens motoras por comboio – e chegam a passar a cada 4 minutos e 35 segundos na Linha Azul, segundo a página do próprio Metro de Lisboa. Isto dá uma capacidade aproximada de 14 000 pessoas por hora para cada lado.
É possível que em ambos os casos a capacidade real seja superior, uma vez que a infraestrutura pode não estar a ser usada na sua capacidade máxima, por exemplo por falta de comboios, limitações do sistema de sinalização, falta de maquinistas, etc.
Então, e os autocarros?
Quanto aos autocarros, podem ter a vantagem de um menor investimento inicial e de maior flexibilidade caso se queira mudar a rota. No entanto, dada a ausência de canais dedicados (faixas BUS e semáforos que fiquem verdes para um autocarro sempre que este se aproxime), especialmente fora do município de Lisboa, terão de se misturar com o trânsito geral. Nesse caso, permitem sensivelmente duplicar o número de pessoas movidas por hora em relação aos carros (para 1000 a 2800 pessoas), o que é bastante menos que multiplicá-lo por 10 ou mais como se consegue com canais ferroviários.
Apesar destas vantagens do modo ferroviário dentro de áreas metropolitanas, não deixa de ser um modo que exige investimento elevado à cabeça, especialmente se for subterrâneo, e cujo traçado é difícil de mudar. É, portanto, importante decidir bem por onde ele deve passar, para que o investimento seja justificado.
A densidade populacional na AML

Olhemos, então, para a densidade populacional (ou seja, residencial) dentro da AML. Não podemos ter estações ferroviárias em cada esquina, pelo que faz sentido tê-las nas zonas onde haja procura elevada, ou onde se antecipa que haja essa procura no futuro.
Porquê densidade populacional? Os locais de trabalho e de estudo também geram viagens, certo? Certíssimo. A escolha de usar a densidade populacional é apenas por pragmatismo. Tanto quanto sei não há, em Portugal, dados abertos sobre os percursos feitos pelas pessoas nas suas deslocações quotidianas. Também não conheço nenhuns dados sobre a densidade de postos de trabalho, que seria importante para esta análise.
No entanto, nos Censos de 2021, cujos dados provisórios já estão disponíveis, temos informação de número de residentes ao nível do quarteirão e do bairro. Podemos analisar a densidade populacional de cada bairro a partir destes dados, e procurar zonas de elevada densidade que estejam longe de estações de metro e comboio.
Para calcular a densidade populacional segue-se este processo:
- os dados provisórios dos Censos 2021 indicam, para cada bairro, quantas pessoas lá residem.
- para cada um dos 2399 bairros da AML, os Censos também nos indicam a zona do mapa que ocupam, permitindo assim calcular a área de cada bairro em metros quadrados.
- usando a população residente em cada bairro e a sua área, podemos calcular a densidade populacional de cada bairro.
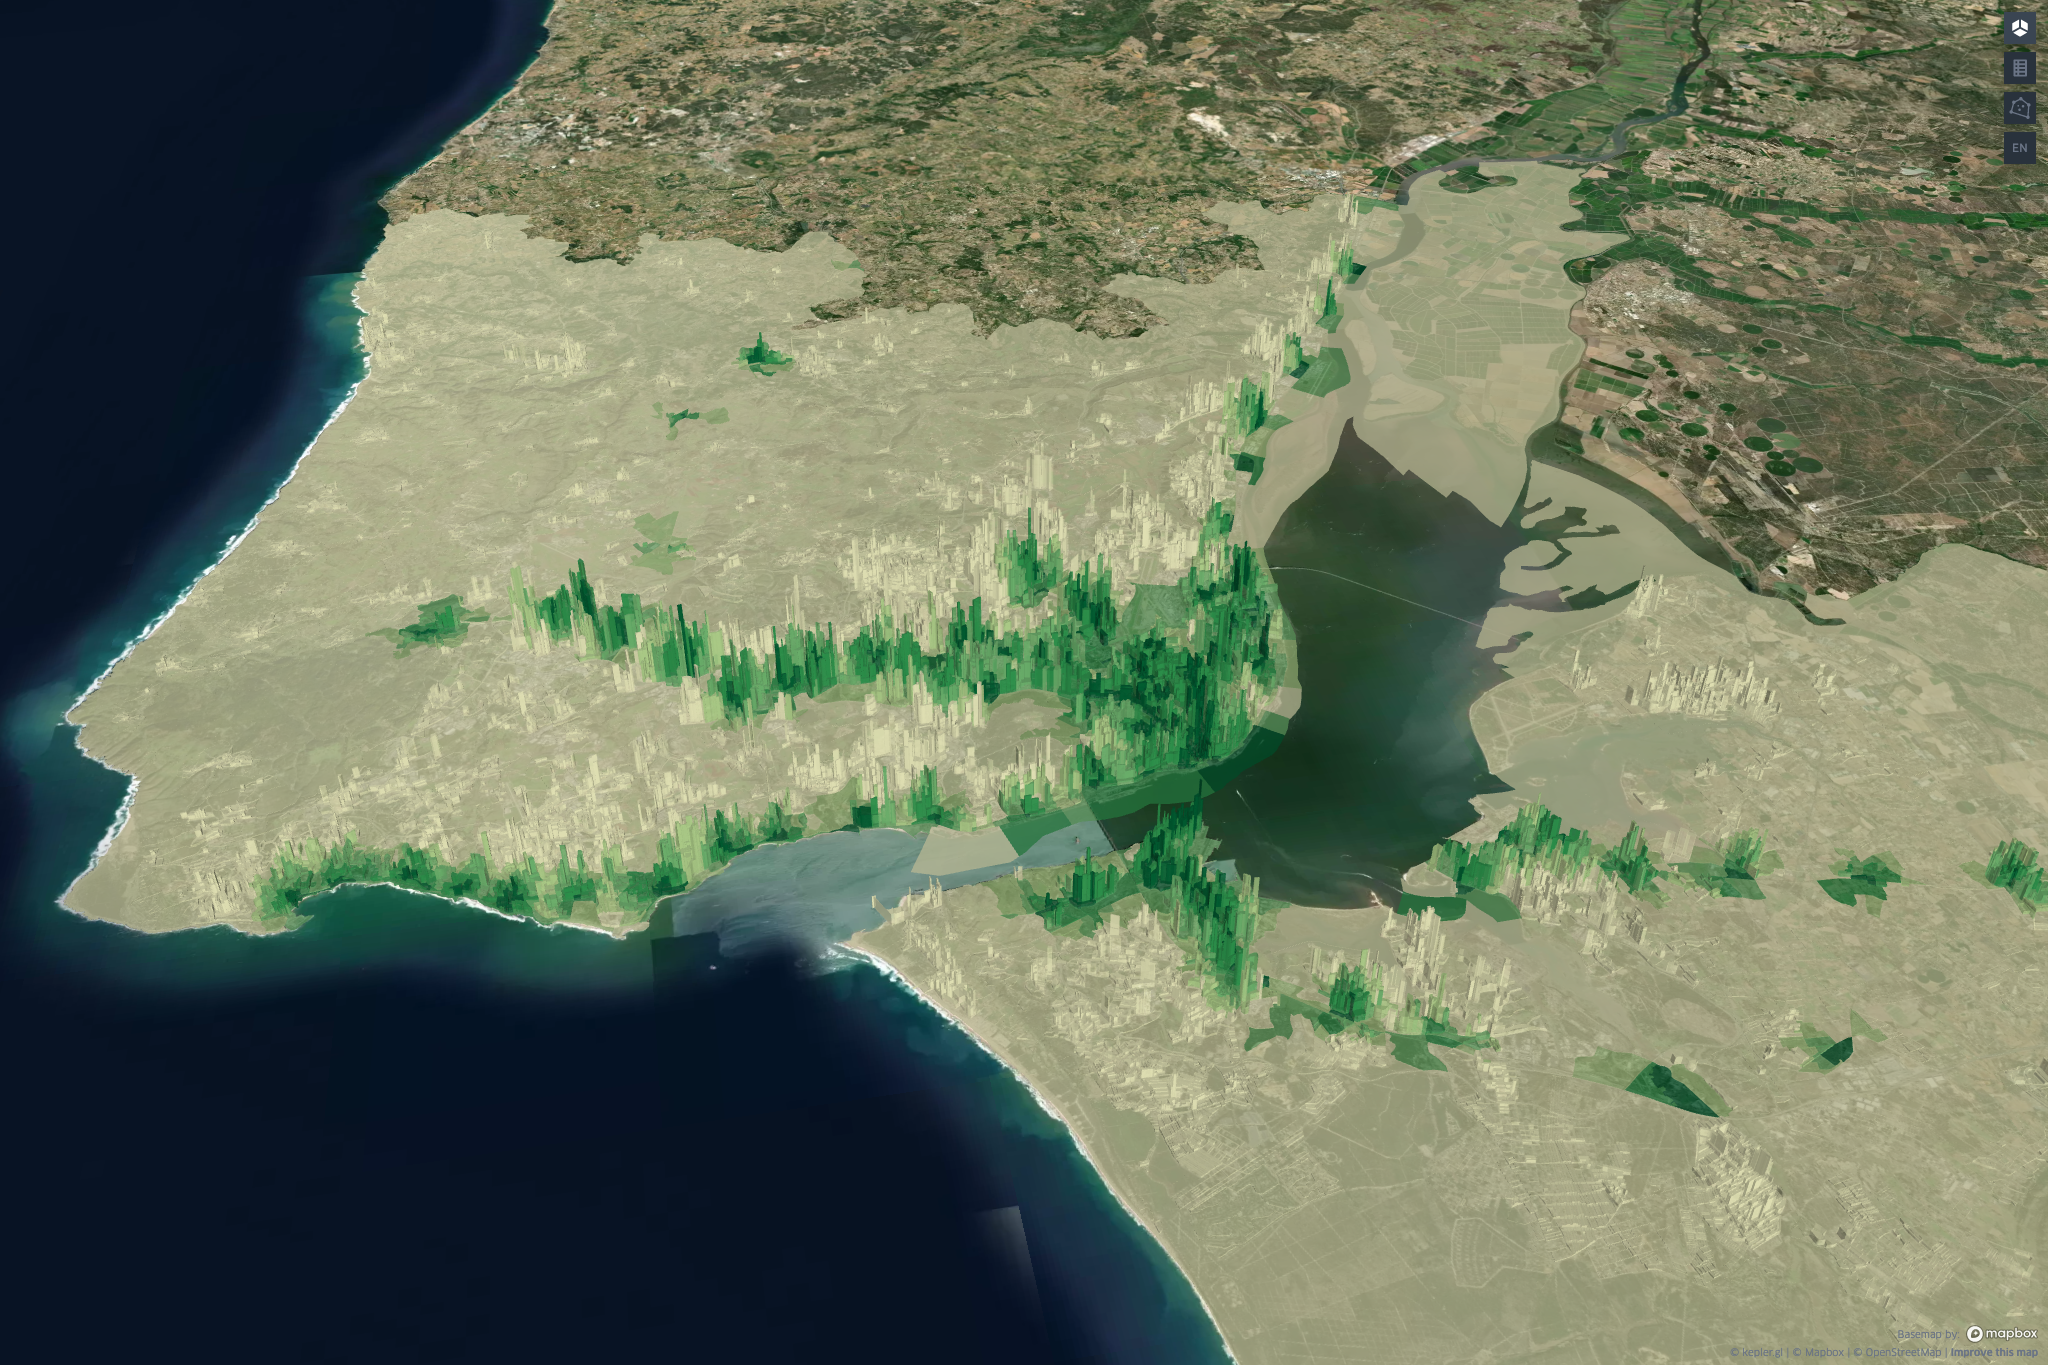
O mapa interactivo em cima mostra a densidade populacional num mapa 3D da AML. Quanto maior a altura dos edifícios, maior a densidade populacional desse bairro. Podes fazer zoom com a roda do rato, clicar com o botão esquerdo para mover o mapa, ou com o botão direito para o rodar. Se passares o ponteiro do rato por cima de um bairro verás informações detalhadas sobre esse bairro – são os dados dos Censos.
Sabendo onde residem mais ou menos pessoas, podemos passar ao passo seguinte: incluir no mapa informação sobre ser fácil ou difícil usar modos ferroviários. Esse é o assunto da Parte 2.
Parte 2 – Tempo a pé a a estações ferroviárias
Na Parte 1, olhámos para um mapa com a densidade populacional da AML. Agora falta encontrar quais as zonas onde o metro e o comboio não sejam opção prática. Para isso podemos calcular o tempo a pé até à estação ferroviária mais próxima.
Para esta análise olhei para as seguintes linhas ferroviárias, num total de 155 estações:
- as quatro linhas do Metro de Lisboa;
- as quatro linhas suburbanas da CP dentro da AML: Linha do Sado (que liga o Barreiro a Praias do Sado, passando por Setúbal), Linha da Azambuja, Linha de Sintra e Linha de Cascais;
- acrescentei ainda as estações da Linha do Oeste da CP que estão dentro da AML, embora não sejam serviços suburbanos;
- a Linha do Sul, operada pela Fertagus, que passa na Ponte 25 de Abril e liga o município de Lisboa a Setúbal, num percurso diferente da linha do Sado;
- o Metro Sul do Tejo.
Pegando no mapa da Parte 1, podemos agora adicionar informação sobre a proximidade a uma estação ferroviária. O processo é o seguinte:
- o Open Street Map diz-nos onde se localiza cada estação ferroviária.
- para cada um dos 2399 bairros dos Censos, que estão no mapa da Parte 1, calculei o centróide, ou seja, o ponto central desse quarteirão.
- finalmente, usei o Open Route Service para calcular o tempo necessário para ir a pé entre todos os centróides e todas as estações ferroviárias. Guardei, para cada quarteirão, a estação mais próxima e o tempo que se leva a pé até ela.
Este último passo não é diferente do que o leitor provavelmente já fez usando aplicações como o Google Maps ou o Apple Maps, mas é automatizado. Isso permite o cálculo de tempos de deslocação a pé entre os 2399 bairro da AML e as 155 estações ferroviárias que mencionei em poucos minutos num computador moderno.
No mapa em cima, as tonalidades de verde representam o tempo de deslocação a pé até à estação ferroviária mais próxima. Há cinco tonalidades de verde para representar os seguintes intervalos:
- 0 a 5 minutos a pé – o verde mais escuro
- 5 a 10 minutos a pé
- 10 a 15 minutos a pé
- 15 a 20 minutos a pé
- mais do que 20 minutos a pé – o tom mais claro
Rodando e fazendo zoom, conseguimos ver no mapa várias zonas densamente povoadas onde a maioria dos bairros estão a mais de 20 minutos a pé de estações ferroviárias.
Nas secções que se seguem olharemos para algumas delas com mais detalhe, começando pela zona oeste de Odivelas, que é o assunto da Parte 3. A Parte 4 analisa a zona leste de Odivelas em conjunto com o Sul de Loures.
Parte 3 – Odivelas Oeste
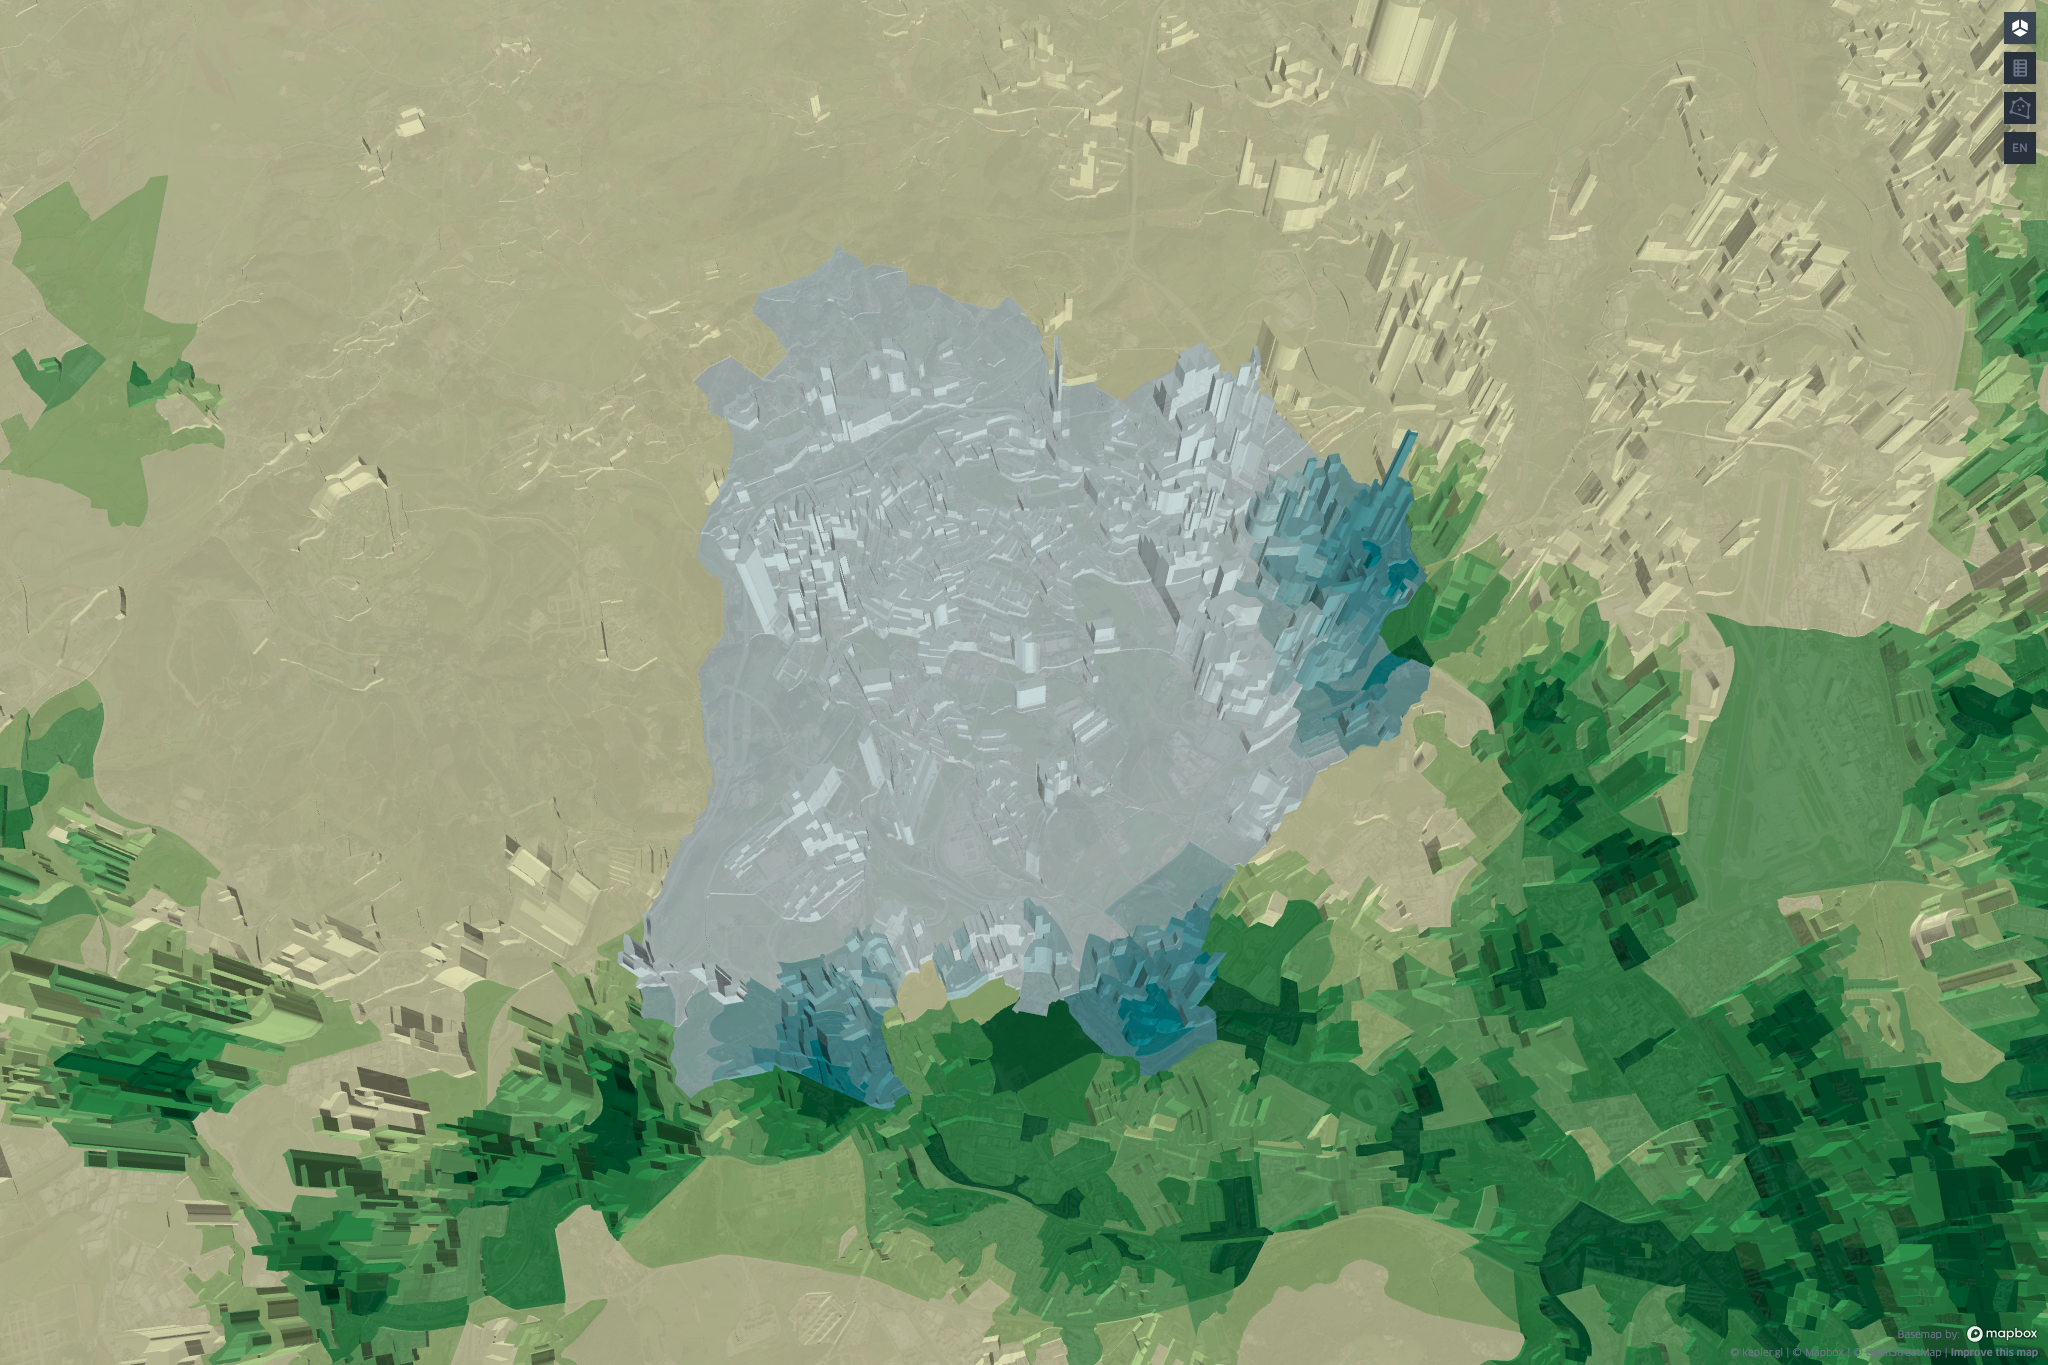
Na Parte 2 olhámos para as zonas de elevada densidade populacional e quão longe a pé estão de estações ferroviárias. Podemos usar esse mapa para analisar em mais detalhe certas partes da AML. A primeira zona, Odivelas Oeste, sob análise está assinalada no mapa em baixo, a azul. Inclui as seguintes freguesias:
- município de Odivelas: Odivelas (freguesia); UF Pontinha e Famões; UF Ramada e Caneças (UF = União de Freguesias, criadas aquando da reorganização administrativa de 2012).
- município da Amadora: Encosta do Sol; Mina de Água.
- município de Sintra: Casal de Cambra.
Esta zona tem:
- Área: 36,97 km²
- População residente: 212 680 pessoas, das quais 125 547 (59%) vivem a mais de 20 minutos a pé de uma estação ferroviária;
- Densidade populacional: 5 753 pessoas por km².
Uma densidade populacional de 5 753 pessoas por km² é bastante elevada. Para termo de comparação, apresenta-se em baixo uma tabela com informação semelhante para as 24 freguesias do município de Lisboa, da mais densa para a menos densa.
| Linha | Freguesia | População | Área (km²) | Densidade populacional (pax/km²) | População 20+ min de estação | % População 20+ min de estação |
|---|---|---|---|---|---|---|
| 1 | Arroios | 33 307 | 2,127 | 15 656 | 0 | 0% |
| 2 | Campo de Ourique | 22 146 | 1,651 | 13 413 | 1 329 | 6% |
| 3 | Areeiro | 21 167 | 1,719 | 12 316 | 0 | 0% |
| 4 | Penha de França | 28 485 | 2,710 | 10 510 | 4 249 | 15% |
| 5 | São Domingos de Benfica | 34 081 | 4,293 | 7 938 | 0 | 0% |
| 6 | Avenidas Novas | 23 261 | 2,994 | 7 769 | 0 | 0% |
| 7 | Santo António | 11 062 | 1,494 | 7 404 | 0 | 0% |
| 8 | Santa Clara | 23 650 | 3,355 | 7 050 | 8 061 | 34% |
| 9 | Lumiar | 46 338 | 6,574 | 7 049 | 3 132 | 7% |
| 10 | São Vicente | 13 956 | 1,985 | 7 029 | 0 | 0% |
| 11 | Alvalade | 33 313 | 5,341 | 6 238 | 64 | 0% |
| 12 | Campolide | 14 794 | 2,774 | 5 334 | 0 | 0% |
| 13 | Marvila | 35 482 | 7,121 | 4 983 | 424 | 1% |
| 14 | Ajuda | 14 313 | 2,876 | 4 977 | 10 008 | 70% |
| 15 | Beato | 12 185 | 2,483 | 4 907 | 641 | 5% |
| 16 | Carnide | 18 029 | 3,688 | 4 888 | 3 590 | 20% |
| 17 | Estrela | 20 308 | 4,603 | 4 412 | 0 | 0% |
| 18 | Benfica | 35 367 | 8,023 | 4 408 | 1 740 | 5% |
| 19 | Misericórdia | 9 660 | 2,192 | 4 407 | 0 | 0% |
| 20 | Parque das Nações | 22 382 | 5,434 | 4 119 | 0 | 0% |
| 21 | Olivais | 32 184 | 8,087 | 3 980 | 0 | 0% |
| 22 | Santa Maria Maior | 10 052 | 3,011 | 3 338 | 0 | 0% |
| 23 | Alcântara | 13 852 | 5,074 | 2 730 | 1 991 | 14% |
| 24 | Belém | 16 549 | 10,425 | 1 587 | 8 830 | 53% |
A zona analisada, do município de Odivelas, ficaria entre as linhas 12 e 13 desta tabela em termos de densidade populacional – mesmo a meio da tabela. No entanto, tirando as freguesias da Ajuda e de Belém (que serão analisadas também no futuro), é fácil ver que as freguesias de Lisboa têm sempre a grande maioria da população a menos de 20 minutos de uma estação ferroviária.
Partes desta zona de Odivelas estão relativamente perto de estações do Metro de Lisboa, nomeadamente da Linha Amarela (a leste) e da Linha Azul (a sul). Mas é inegável que a maioria da população desta zona não usará o metro regularmente, mesmo que trabalhe ou estude perto de uma estação de metro, dado que as estações estão demasiado longe da sua residência. Não é por acaso que o plano de expansão do Metro de Lisboa de 2009 incluía expansões a servir esta zona, com prolongamento da Linha Amarela, agora previstas como metro de superfície (futura Linha Violeta).
A seguir, na Parte 4, olharemos para a zona leste de Odivelas em conjunto com o sul de Loures.
Parte 4 – Odivelas Leste e Loures Sul
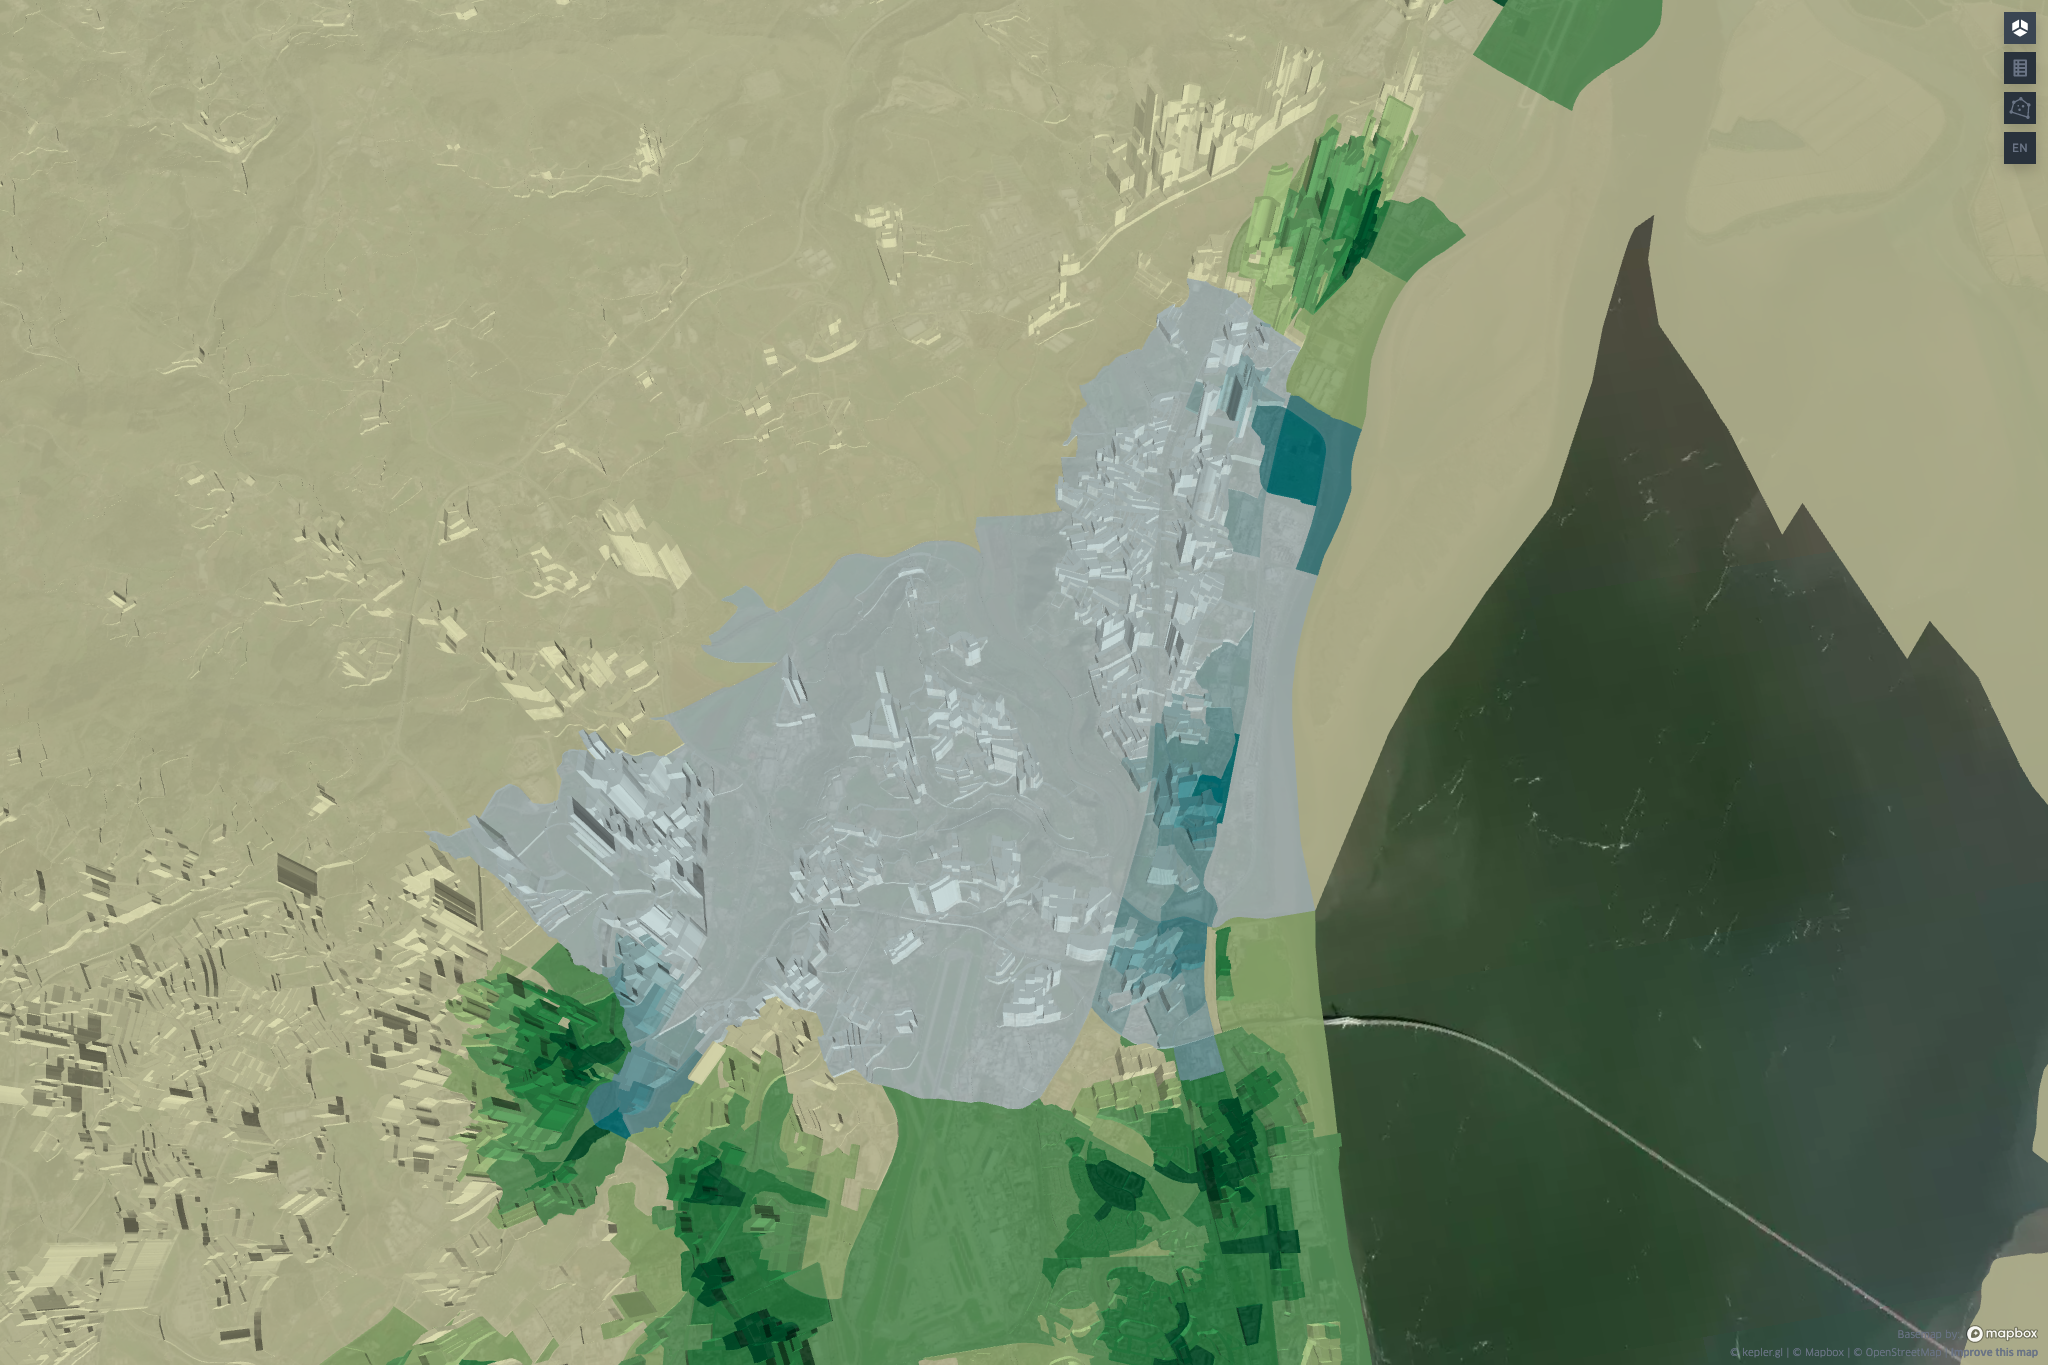
Na Parte 3 olhámos para a zona oeste do município de Odivelas. Olhemos agora para a zona leste desse município, juntando também a parte sul do município de Loures, já que se nota alguma continuidade na densidade populacional entre estes dois municípios.
A zona sob análise inclui as seguintes freguesias:
- município de Odivelas: UF Póvoa de Santo Adrião e Olival Basto.
- município de Loures: UF Moscavide e Portela; UF Sacavém e Prior Velho; UF Santa Iria de Azóia, São João da Talha e Bobadela; UF Camarate, Unhos e Apelação.
Esta zona tem:
- Área: 44 86 km²
- População: 149 988 pessoas, das quais 115 936 (77%) vivem a mais de 20 minutos a pé de uma estação ferroviária;
- Densidade populacional: 3 343 pessoas por km².
Esta zona é maior que a anterior, e menos densa. É possível ver largas áreas no seu interior com baixa densidade populacional, por exemplo onde passa o rio Trancão. É também interessante verificar que a zona mais a leste desta área, que é a UF Santa Iria de Azóia, São João da Talha e Bobadela, até está perto de uma linha ferroviária (a Linha da Azambuja, operada pela CP), mas as duas estações mais próximas, Bobadela e Santa Iria, não servem adequadamente as zonas onde as pessoas vivem.
Dado que a linha ferroviária já existe, poder-se-ia ingenuamente pensar em fazer uma nova estação ou apeadeiro entre estas duas estações. No entanto, por mais realistas que os videojogos sobre cidades estejam a ficar, na vida real não é só clicar num botão para fazer uma estação no meio de uma zona urbana consolidada. Soluções mais credíveis para esta UF seriam um bom serviço de autocarros, com canais dedicados, e uma boa rede ciclável que neste momento não existe (como se pode ver no site ciclovias.pt).
Uma curiosidade: tecnicamente, o município de Loures tem metro – a fronteira entre Lisboa e Loures passa na Rua 1º de Maio, em Moscavide, e duas das entradas para a estação de metro de Moscavide, na Linha Vermelha, são no lado norte desta rua, já no município de Loures. No entanto, este mapa mostra que há uma grande extensão de Loures, com densidade populacional razoável, sem comboio nem metro ao pé.
As zonas da Portela e de Sacavém estavam também contempladas no plano de expansão do Metro de 2009, neste caso com um novo ramal da Linha Vermelha. Actualmente, essa expansão está a ser pensada através de um sistema de metro de superfície, o futuro LIOS Ocidental. Uma outra extensão, da Linha Amarela para o Infantado, iria também servir o município de Loures, mas não as zonas aqui analisadas. Passaria mais a norte, por Santo António dos Cavaleiros e pela cidade de Loures. Este prolongamento está também a ser estudado neste momento, na futura Linha Violeta já referenciada. Ao contrário do LIOS Ocidental, esta Linha Violeta já conta com financiamento assegurado.
Agora que terminámos de olhar para estas duas zonas, podemos falar de quais seriam os próximos passos. Esse é o assunto da Conclusão deste texto.
Parte 5 – Conclusão
Próximos passos
Há muito para onde ir após esta análise. Em primeiro lugar, há outras zonas da AML cujas análises ainda não publiquei, mas que estão em curso, incluindo:
- Lisboa Oeste
- Oeiras
- Almada
- Montijo
- Seixal
A análise pode ser também estendida a outras partes do país, nomeadamente à Área Metropolitana do Porto ou à Região de Coimbra, que tem recentemente debatido o encerramento da sua estação ferroviária mais central.
Seria igualmente importante analisar o desempenho de outras partes do sistema de mobilidade da AML, em particular o desempenho dos autocarros. Ao contrário dos sistemas ferroviários aqui analisados, os autocarros são geralmente vulneráveis ao trânsito. Mesmo que existam linhas de autocarro a servir certas zonas, isso não significa que esse serviço tenha a frequência, pontualidade e rapidez necessárias para ser competitivo com o uso do automóvel privado.
Detalhes técnicos
Seria possível escolher à mão os bairros um a um para incluir nestas zonas, o que permitiria delimitar zonas mais densas ou com maior percentagem de população longe de estações. Optei ainda assim por usar freguesias porque:
- é mais simples de explicar qual a área sob análise;
- permite mais facilmente a quem lê saber quais os órgãos políticos que governam essa área (as Juntas de Freguesia e Câmaras Municipais correspondentes);
- é menos arbitrário.
Seria também possível corrigir, para as freguesias que incluem “bairros” sobre o rio Tejo, os valores da área respectiva. Optei por não o fazer pelas seguintes razões:
- alguns bairros incluem grandes áreas sobre o rio mas também algumas áreas terrestres, e não é possível separar uma da outra nos dados dos Censos;
- o mesmo raciocínio justificaria outras correções, como por exemplo retirar a zona do aeroporto de Lisboa da freguesia dos Olivais. Se fôssemos por aí, haveria um grande número de correções algo arbitrárias a fazer.
Os dados provisórios dos Censos 2021 foram obtidos através do site do INE.
Os tempos de deslocação a pé foram calculados usando o Open Route Service, que se baseia no Open Street Map. O Open Route Service permite pedir direcções no seu site, mas rapidamente chegamos ao limite diário quando tentamos o número de caminhos necessários para esta análise. Assim, optei por colocar a correr no meu computador uma cópia do Open Route Service que eles próprios disponibilizam no GitHub. Isto permite-me calcular tantos caminhos a pé quanto eu queira, limitado apenas pelo poder computacional do meu computador.
O Open Street Map também foi usado para determinar a posição de cada estação ferroviária. Seria possível usar alternativas como o Google Maps, e a sua API de direcções, mas preferi optar por dados e programas abertos que qualquer pessoa pode consultar e até corrigir. Além disso, a API do Google Maps é paga.
O tratamento de dados foi feito utilizando um computador pessoal e software Python. A maioria dos cálculos numéricos foram feitos com GeoPandas e os mapas foram feitos usando Kepler.gl, um software aberto de visualização de dados geográficos feito pela Uber.
Este trabalho foi desenvolvido por Miguel Almeida – cientista de dados com uma grande paixão por mapas que ajudem a compreender cidades, mobilidade e sustentabilidade – e foi publicado originalmente em Maio de 2022 aqui. Foi devidamente editado por Mário Rui André para publicação no Lisboa Para Pessoas.