Cycle Paths? Municipalities in the Lisbon metropolitan area now have at their disposal a digital tool that helps to plan cycling networks that promote a true modal shift from cars to bicycles.
The 18 municipalities in the Lisbon metropolitan area (amL) now have at your disposal a digital tool to help them plan cycling networks. A biclaRdeveloped by Instituto Superior Técnico at the request of Transportes Metropolitanos de Lisboa (TML), indicates in which streets and avenues the construction of bicycle lanes can lead to a greater transfer of trips from car to bicycle, according to different objectives.
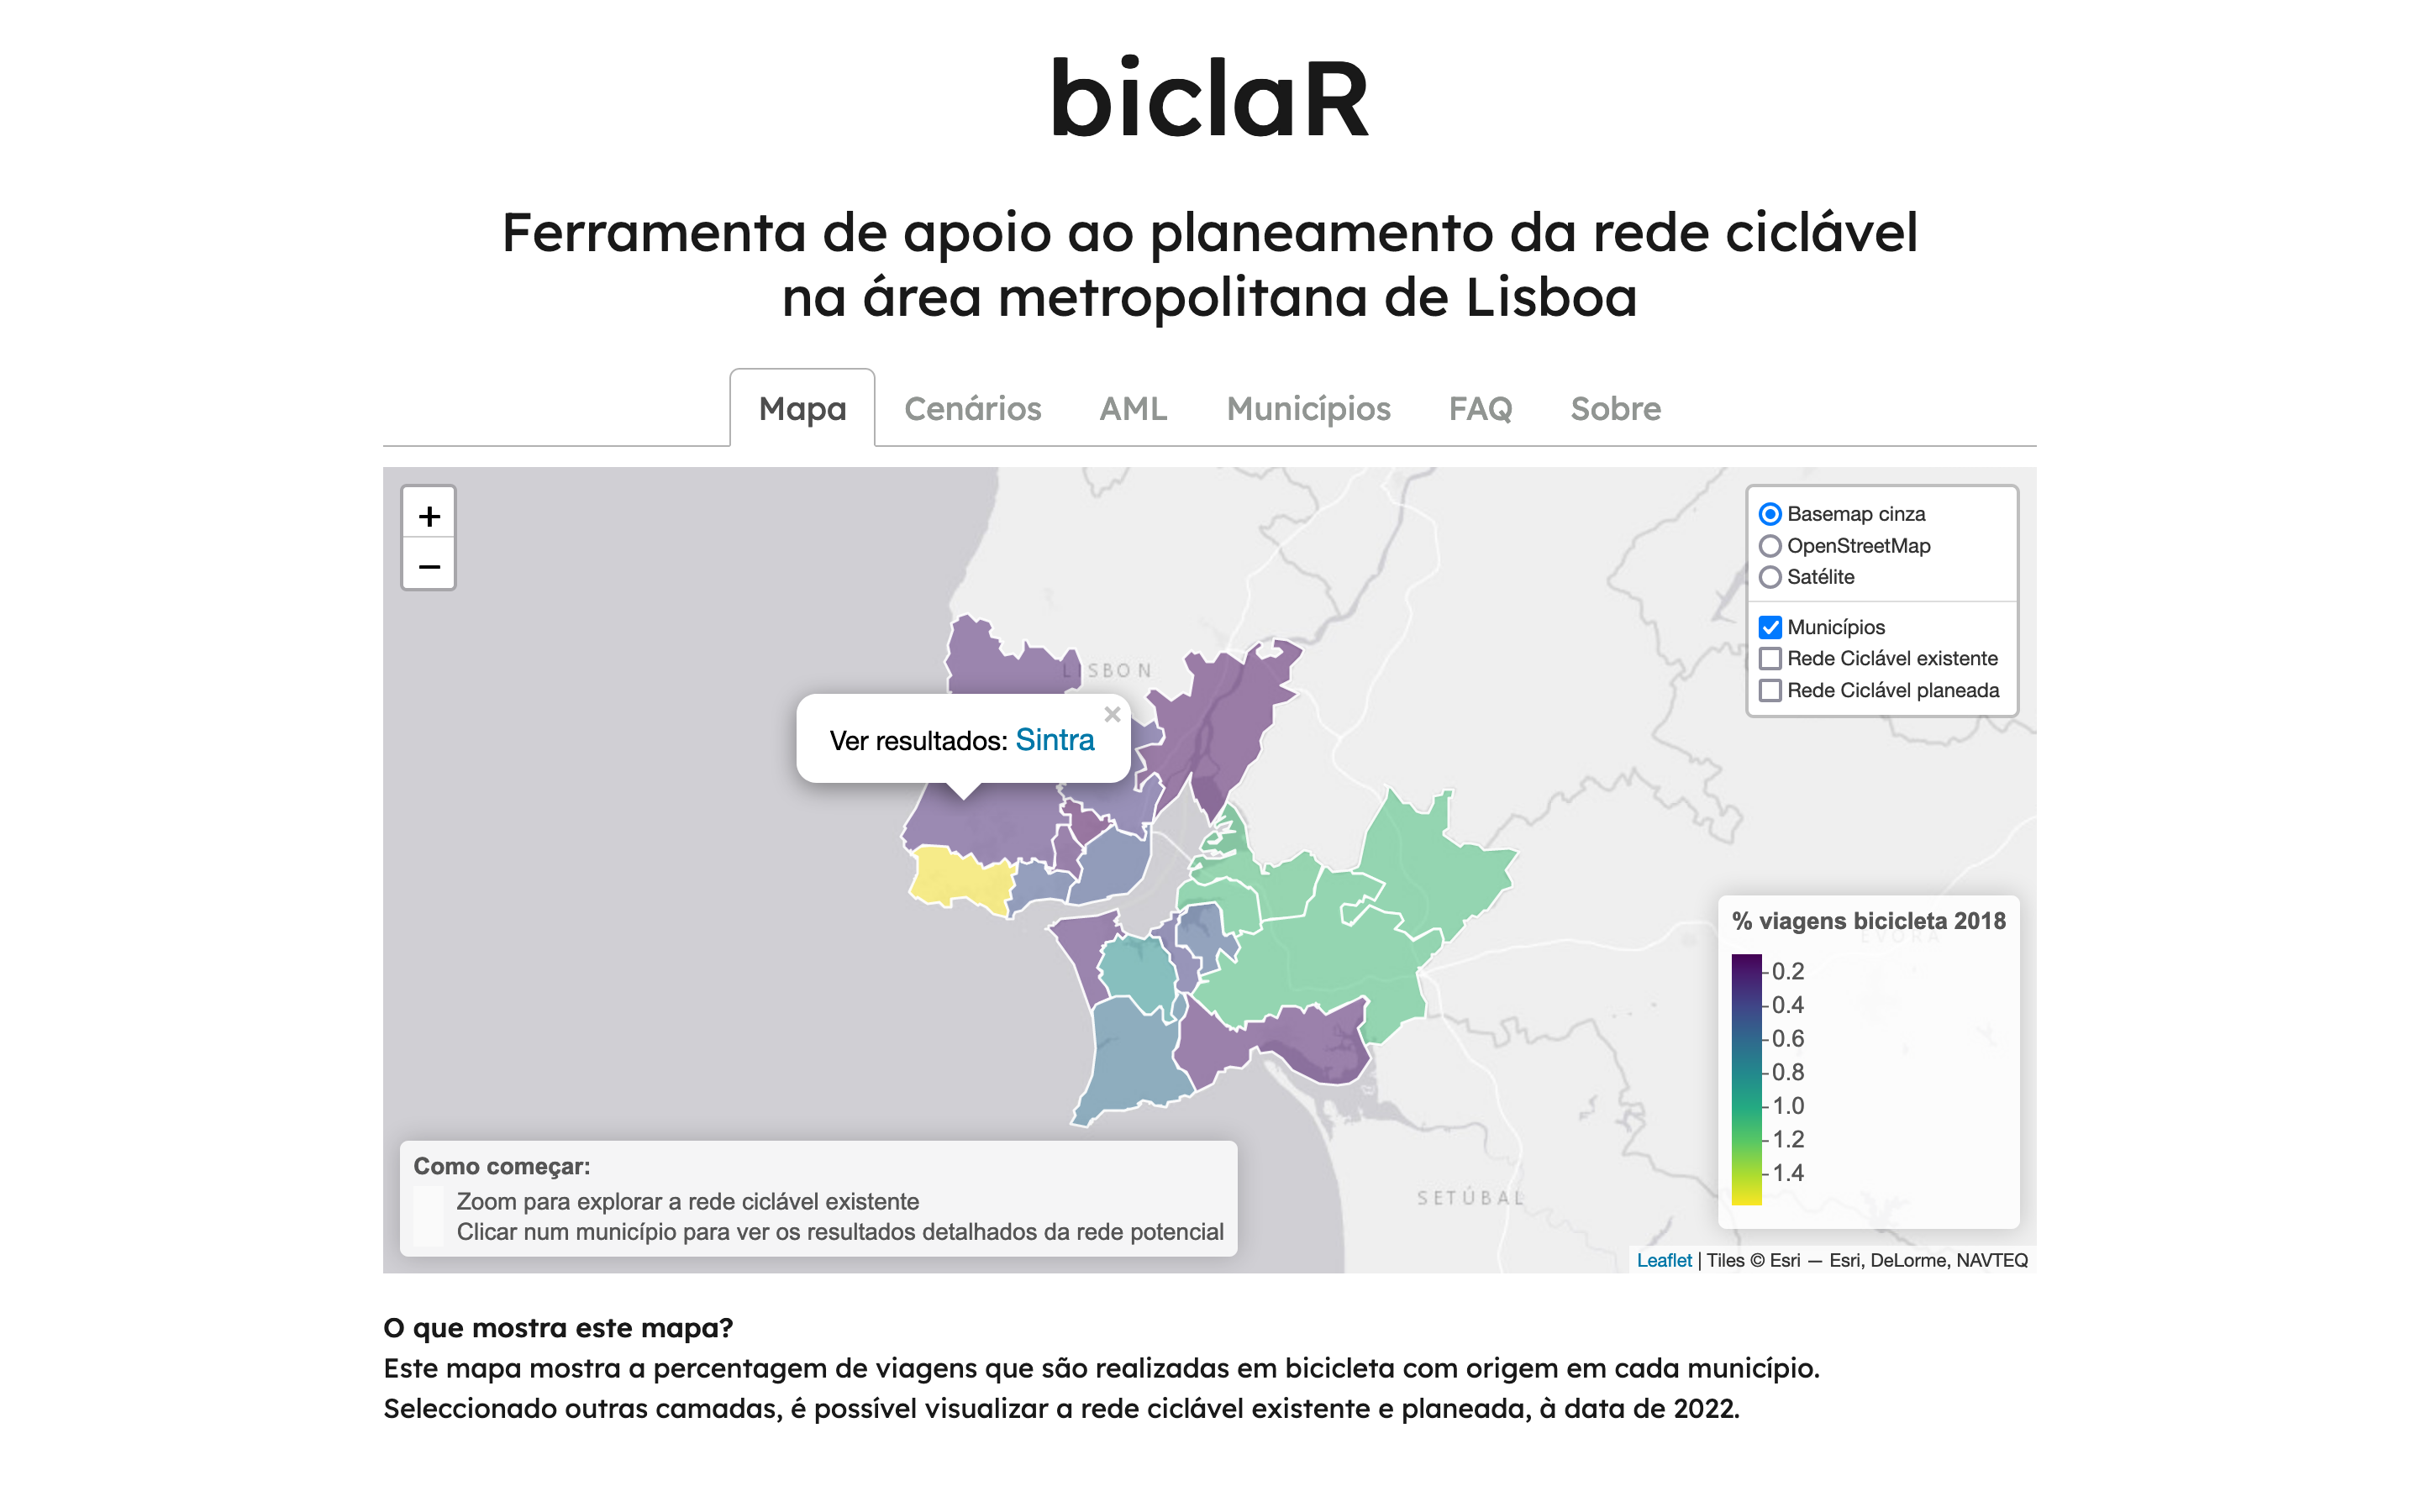
biclaR starts from data from the Mobility Survey conducted by INE in 2017/2018 - which presents the possible radiograph of trips made in amL - to identify the potential modal shift from car to bicycle, according to one of three scenarios:
- a more conservative scenario of trips up to 5 km which can be done by bicycle (including with the use of river transport between the two banks);
- an ambitious scenario of trips up to 10 km that can be made by electric bicycle;
- a third scenario of trips that can be made by public transport and by bicycle (intermodality)with this being used for the first and/or last part of the trip, up to a distance of 5 km.
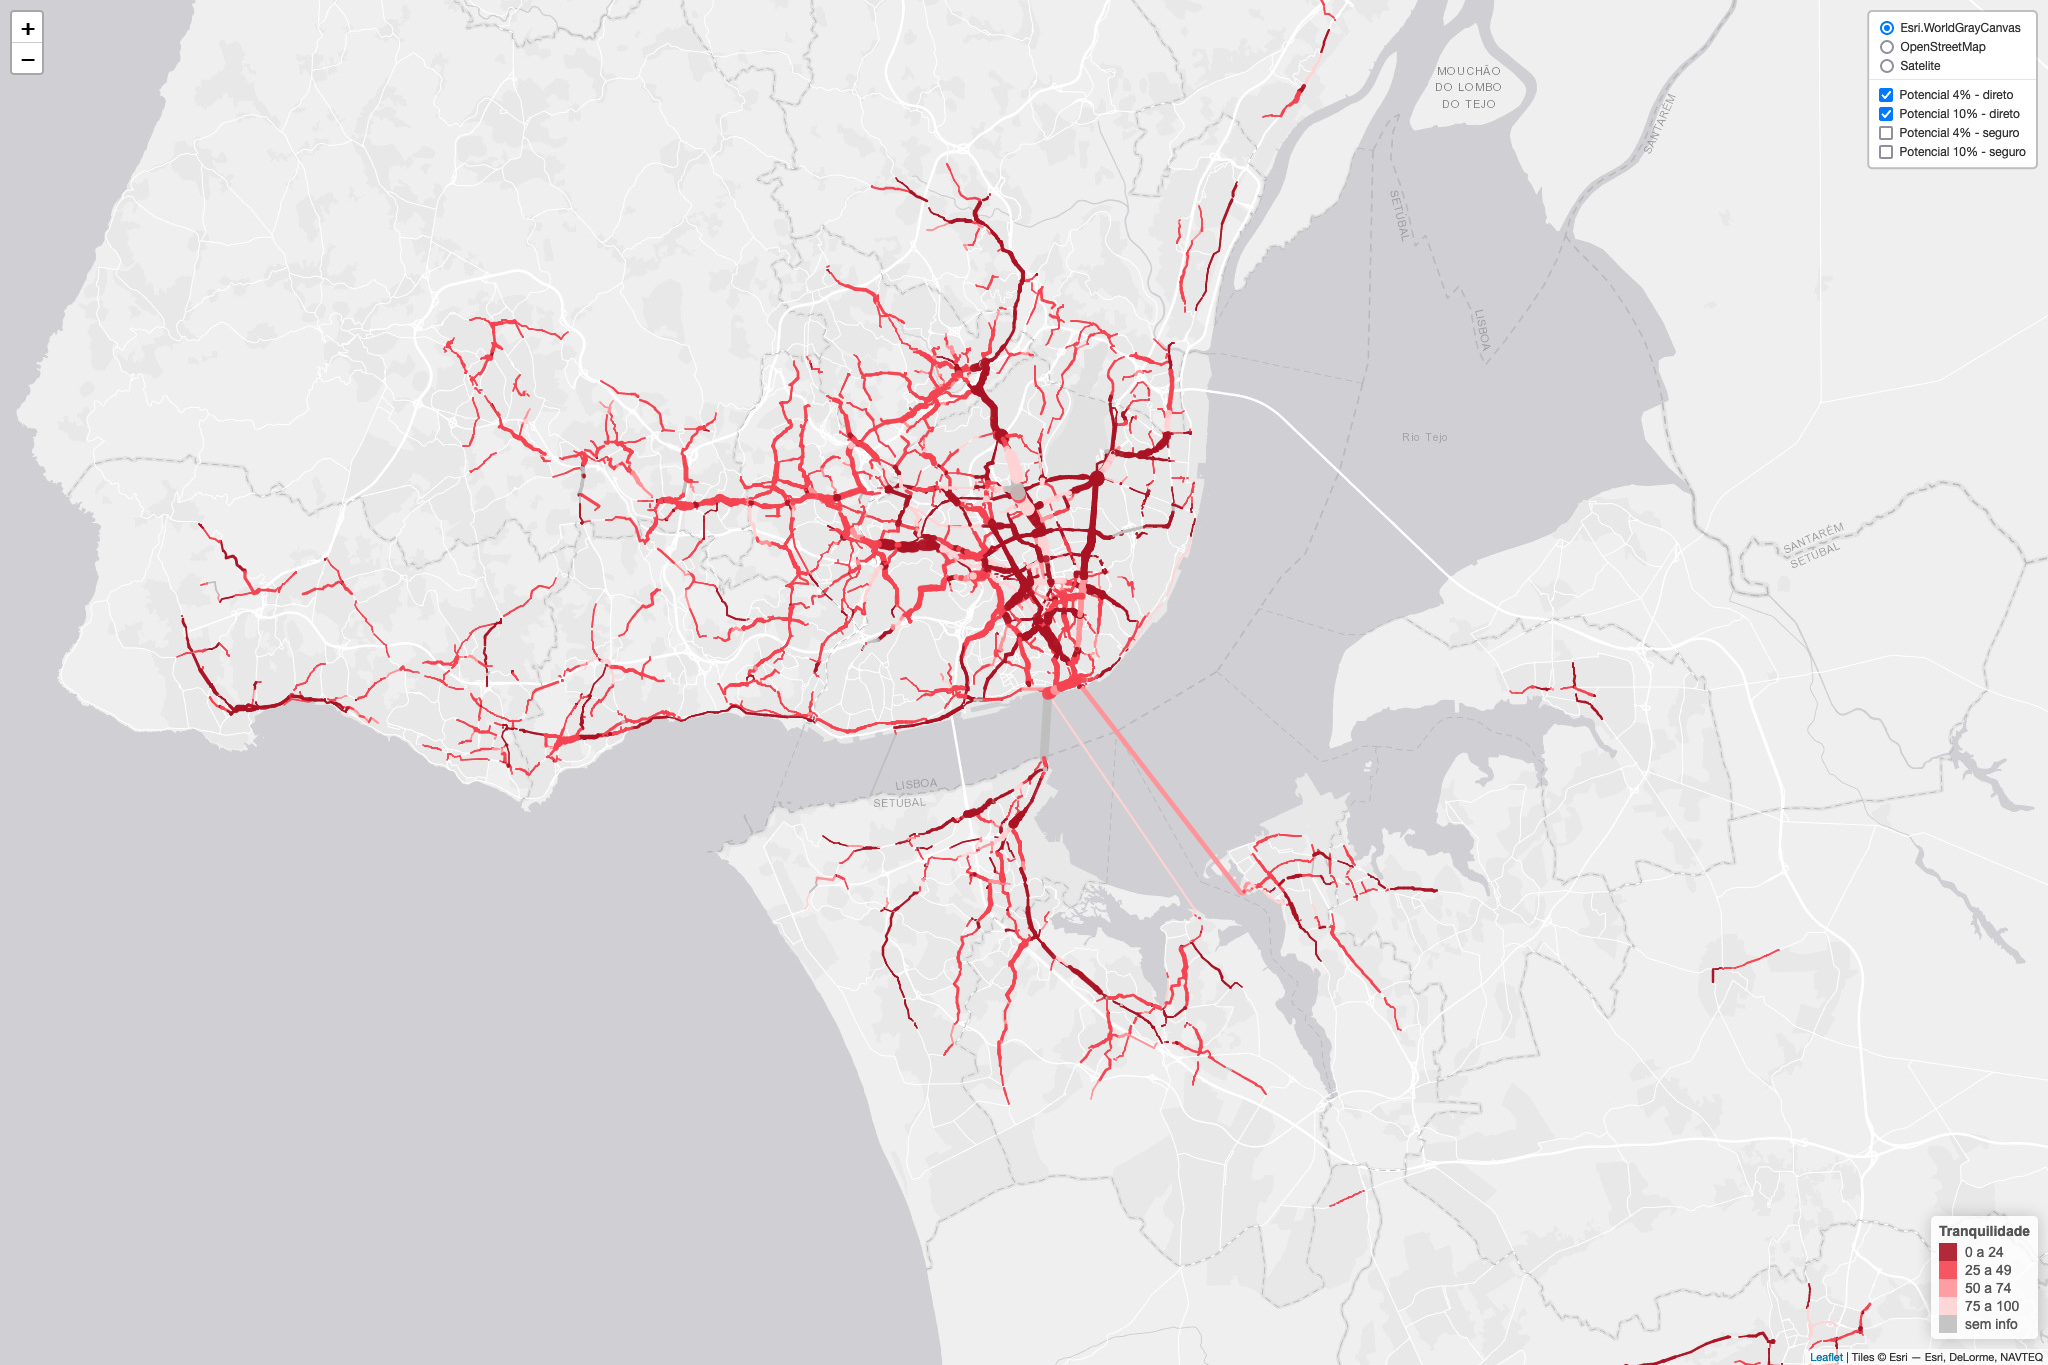
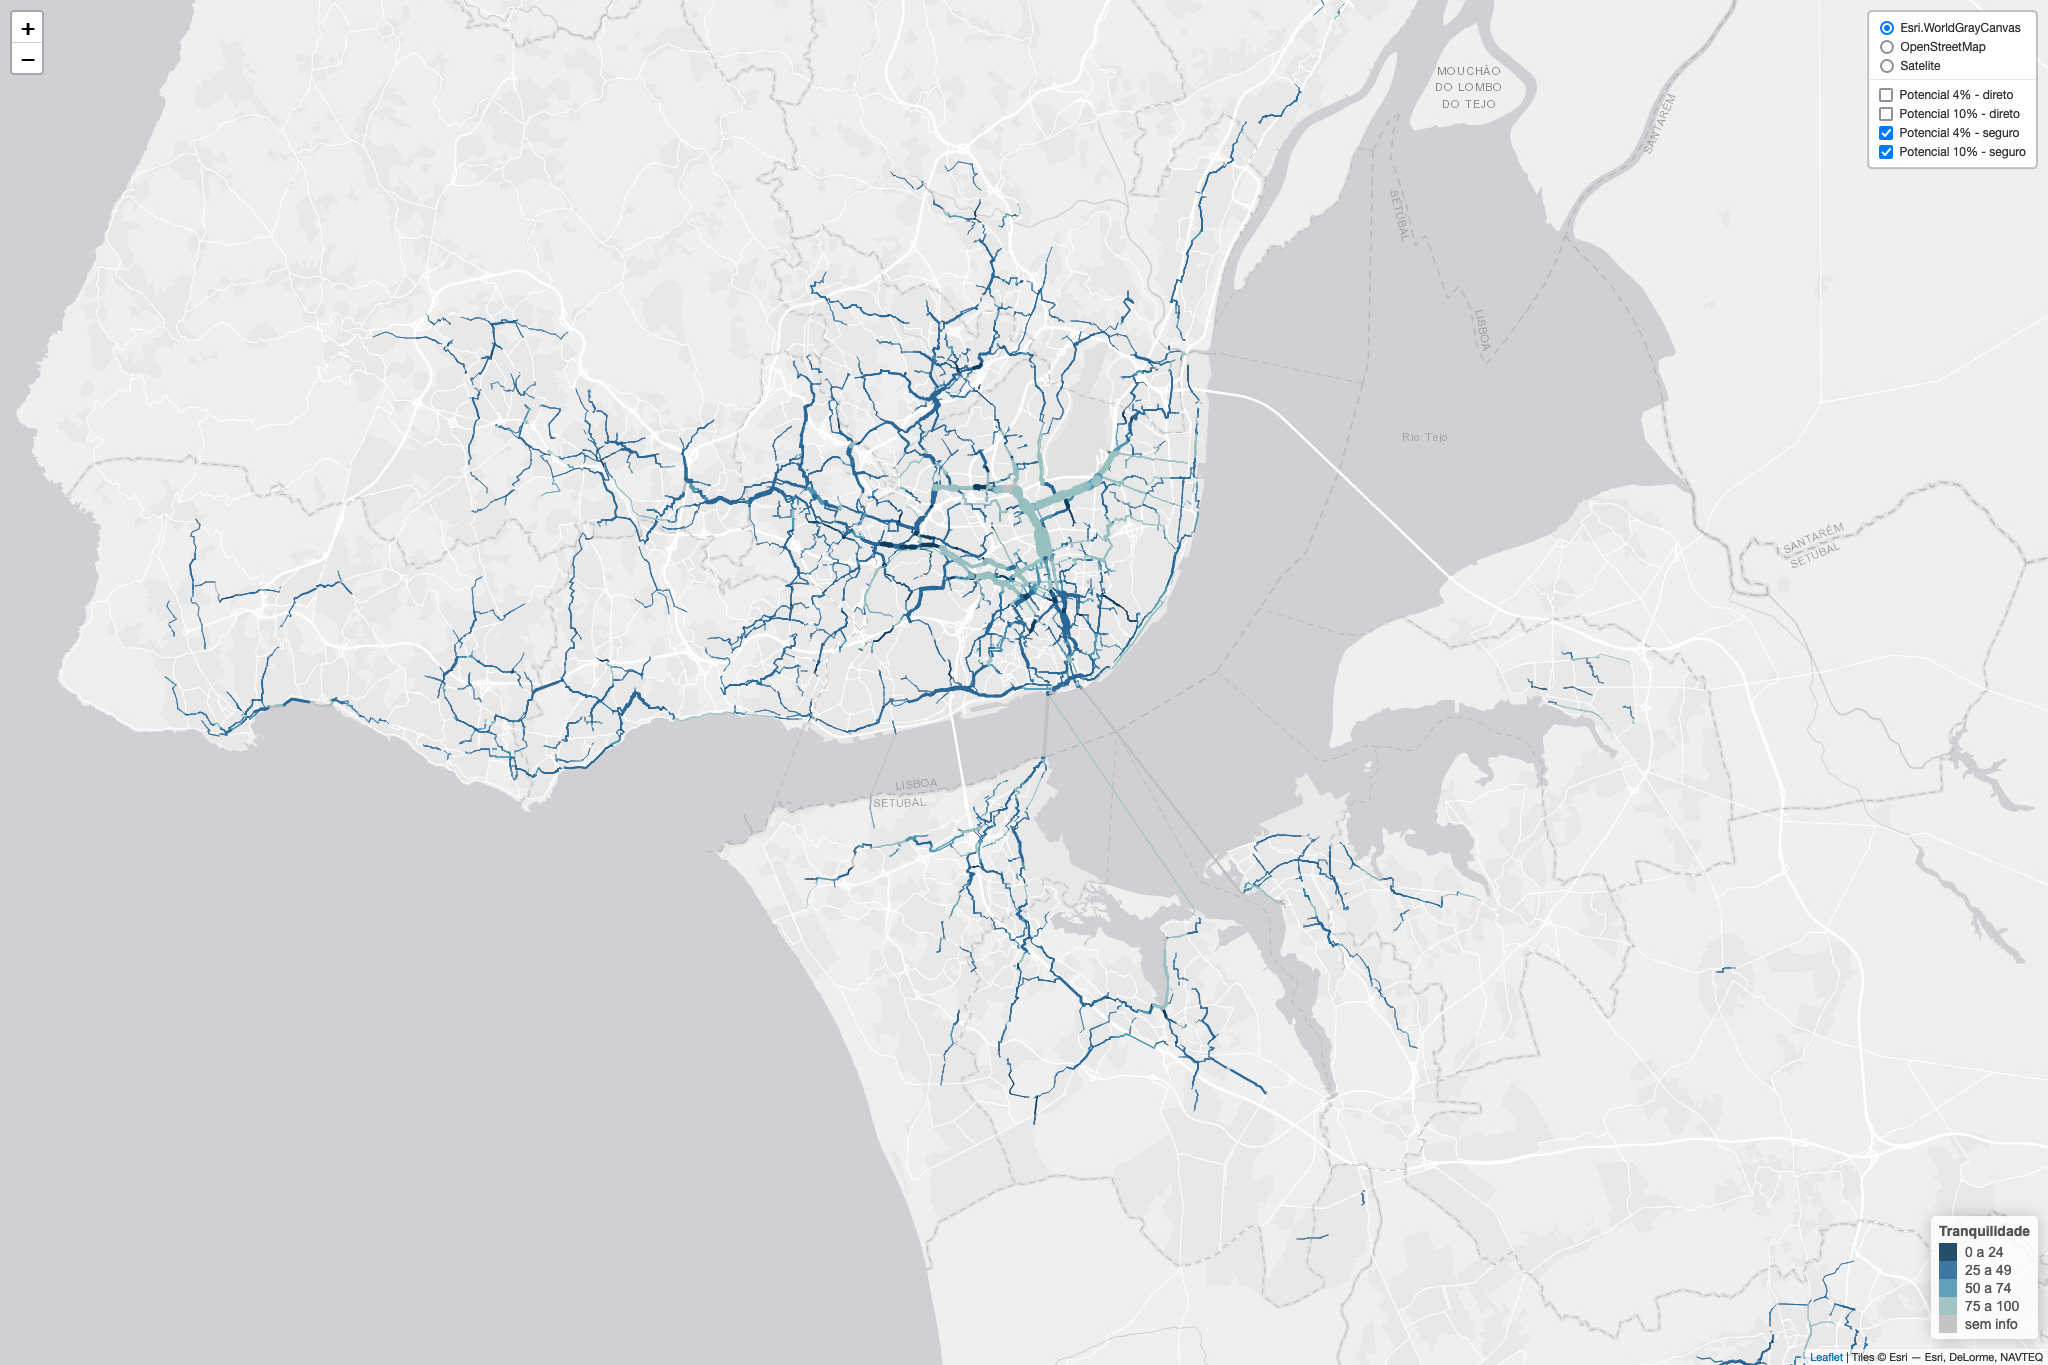
For each scenario (the user chooses which scenario to analyze), the biclaR shows a map of priority connections to be established in order to promote a shift from car to bicycle and in accordance with the goals of the National Strategy for Active Cycling Mobility (ENMAC) 2020-2030 - that by 2025, 4% of urban trips will be made by bicycle, and that this percentage will be 10% by 2030.
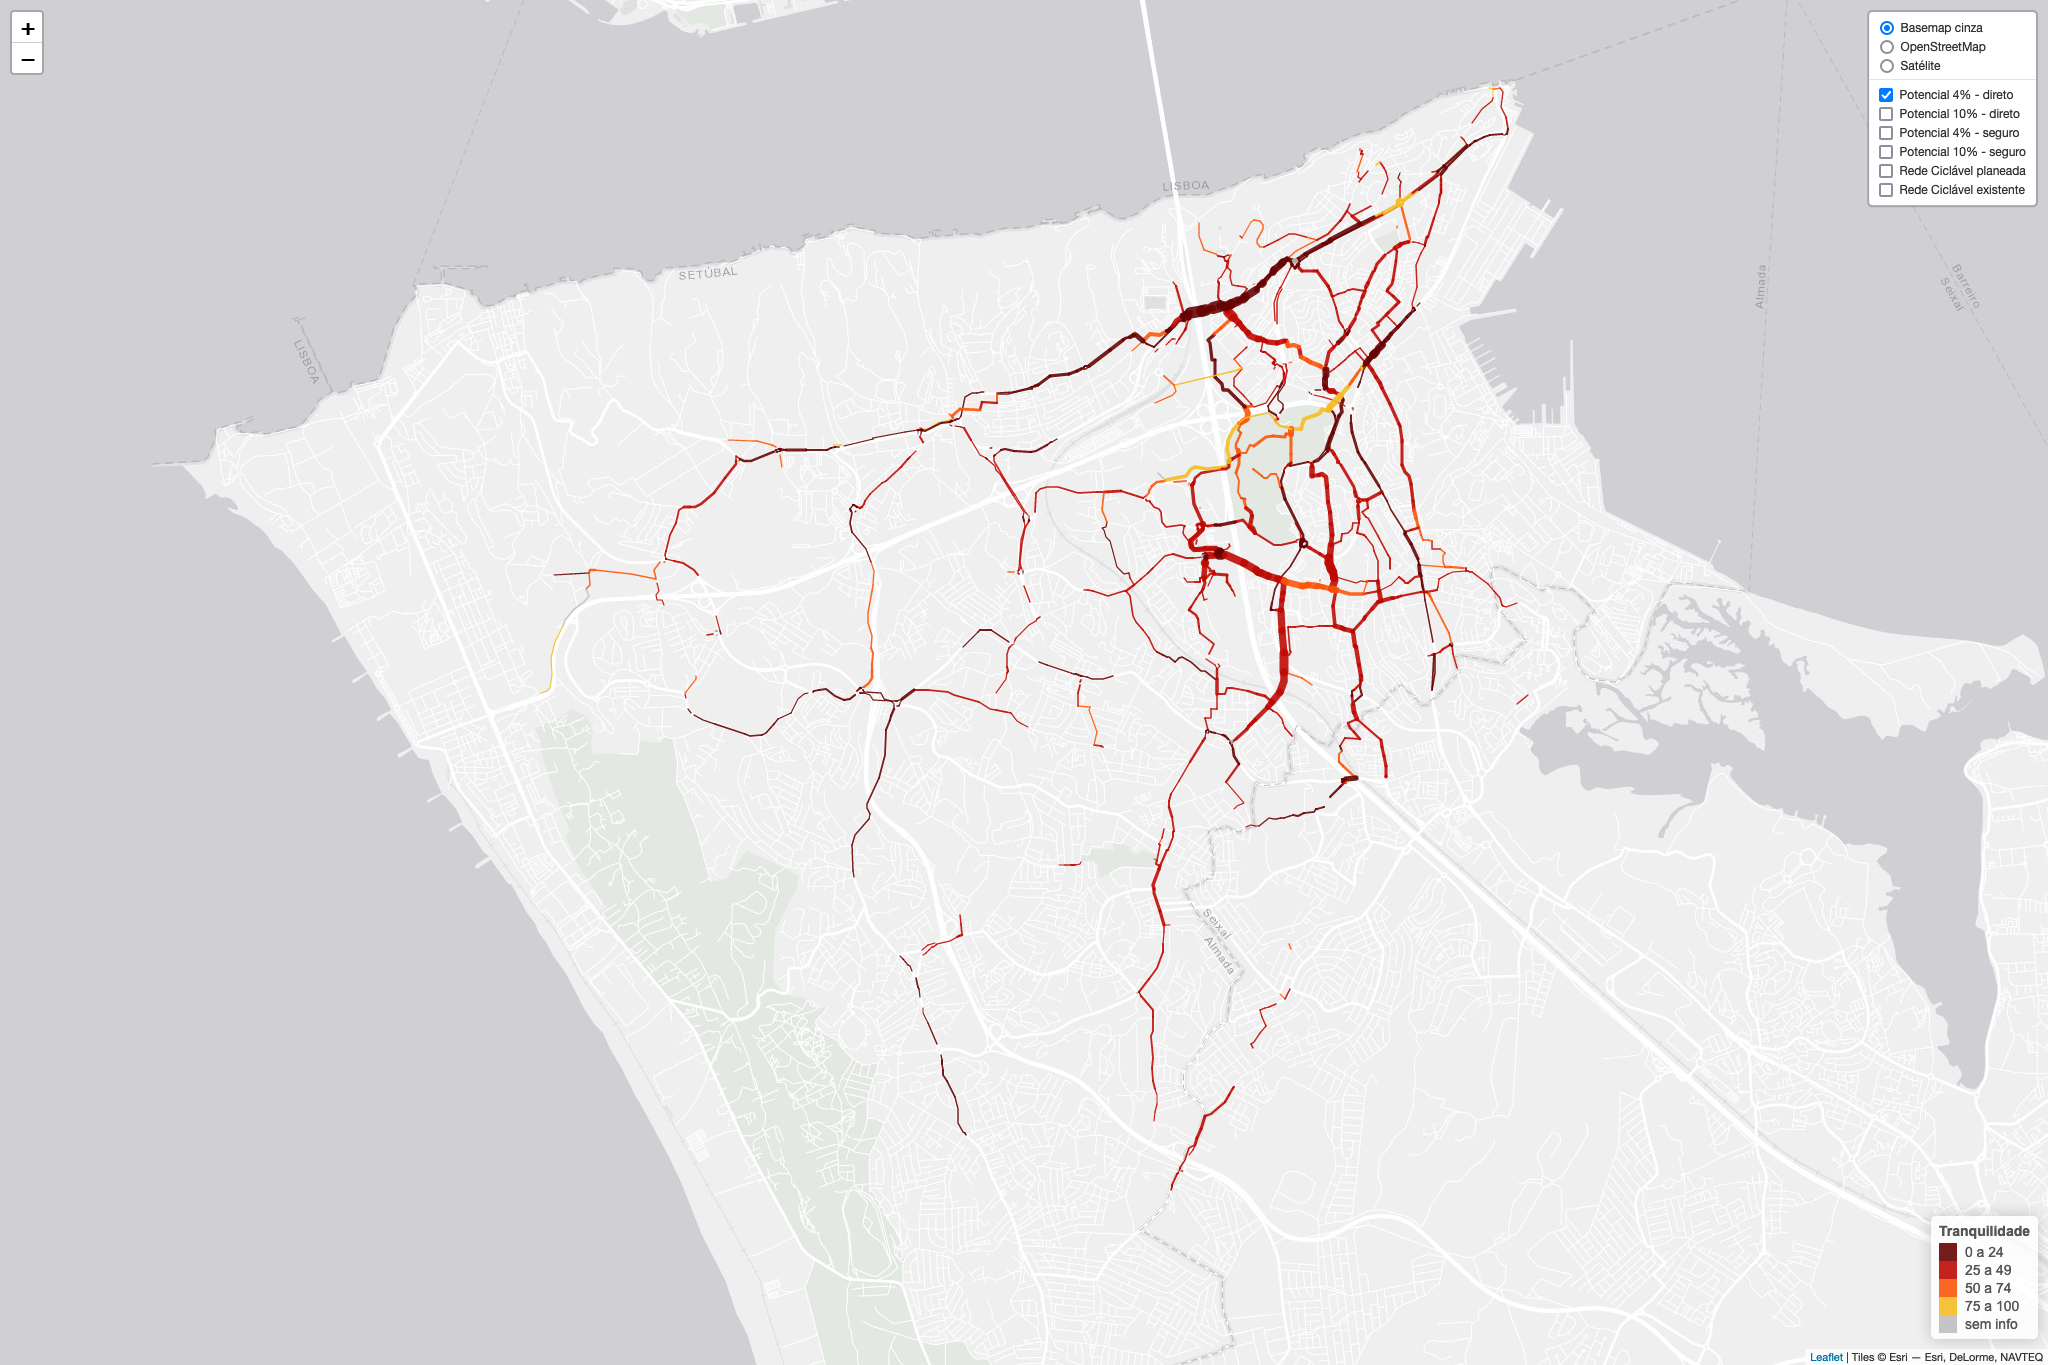
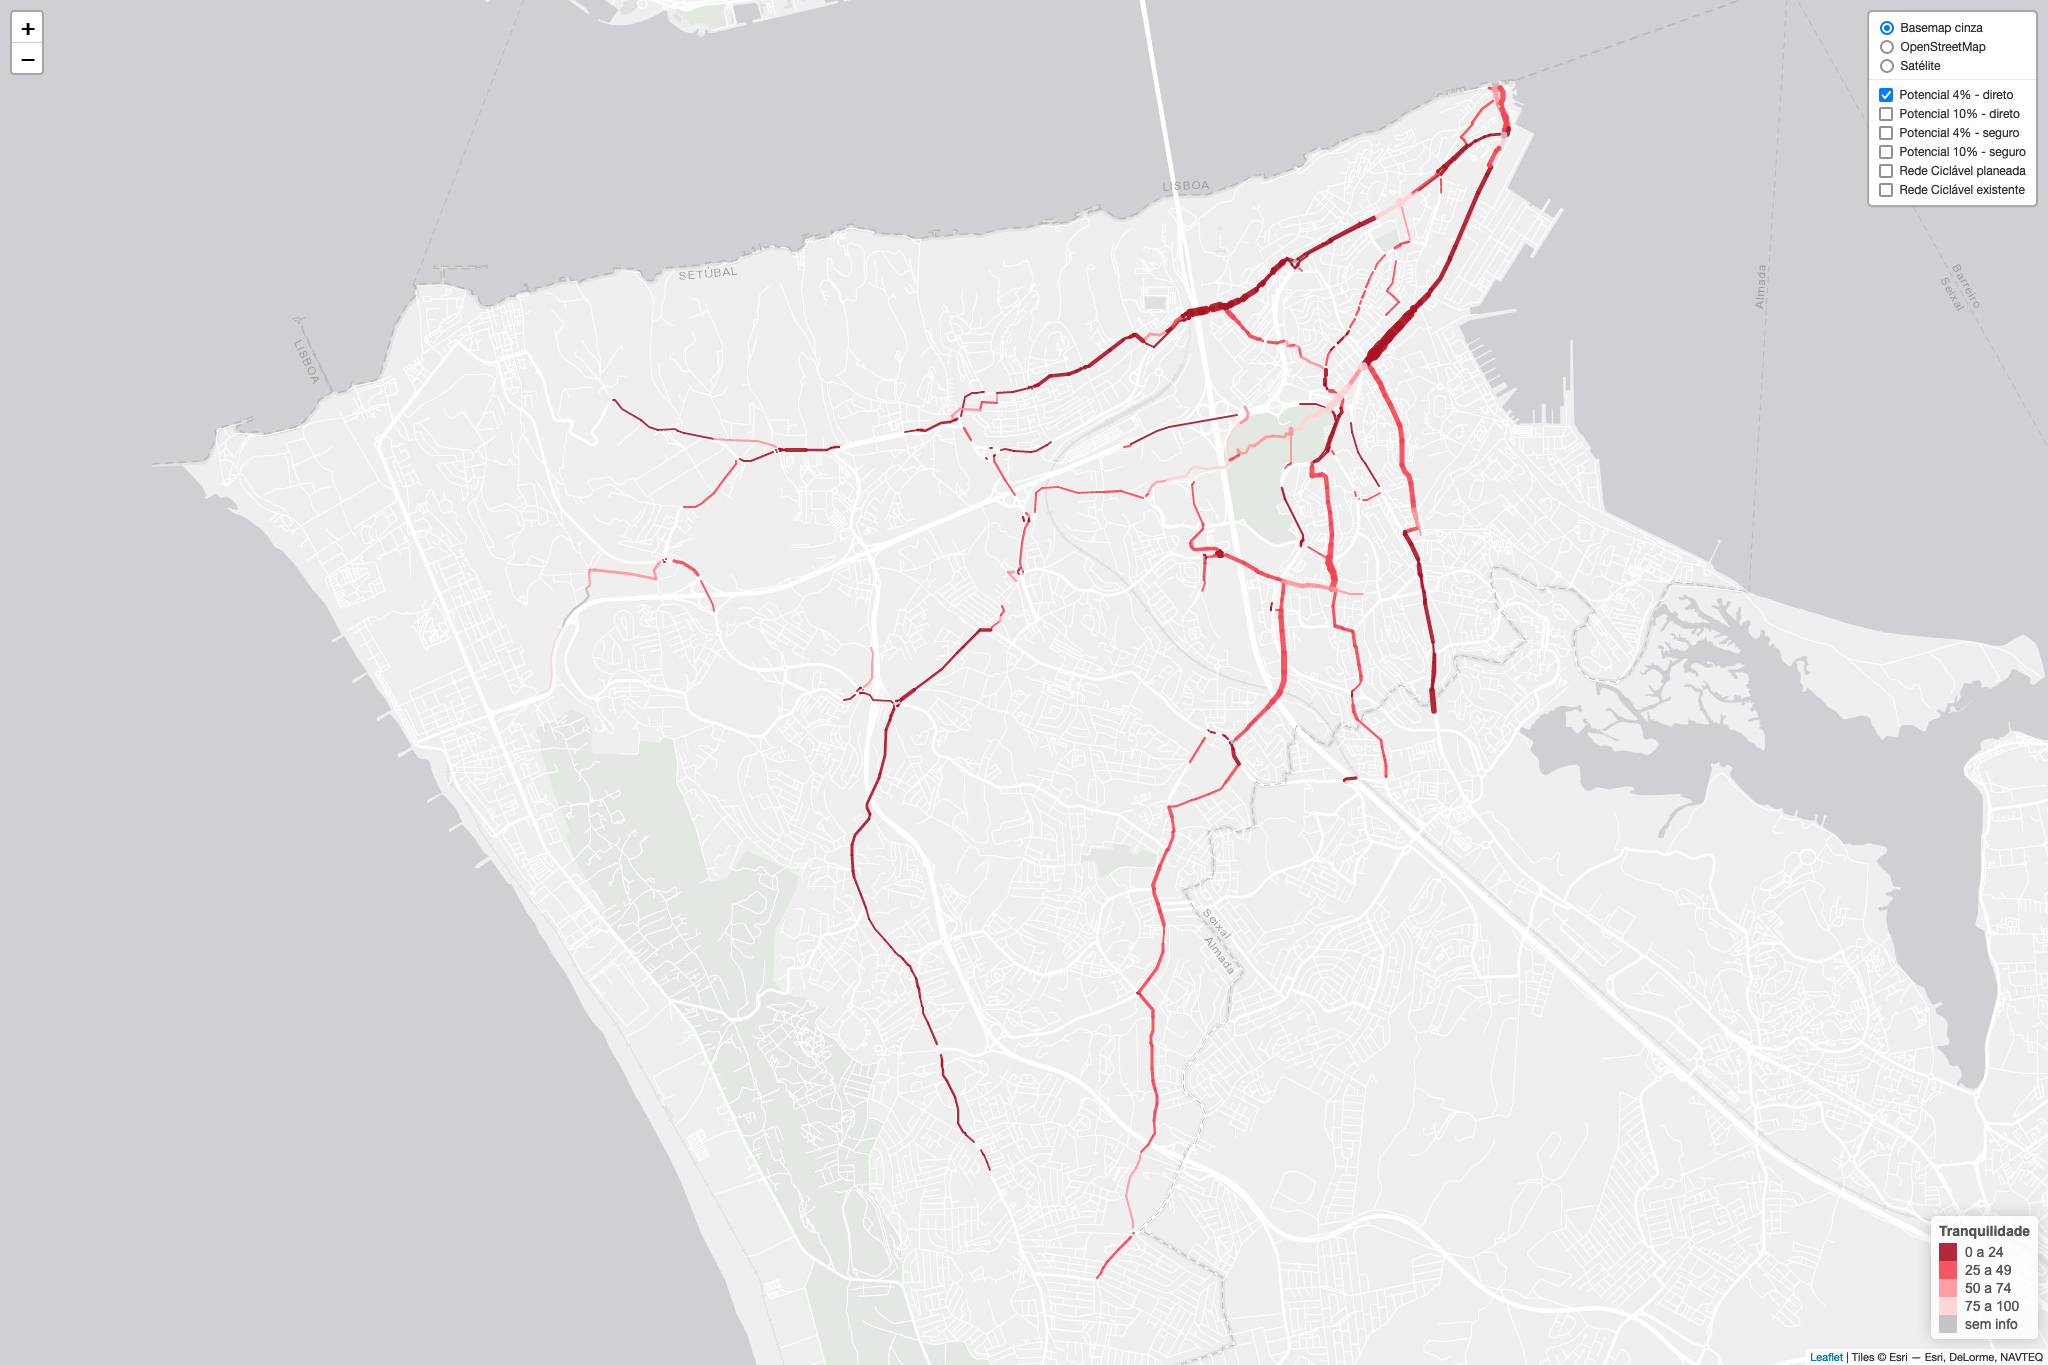
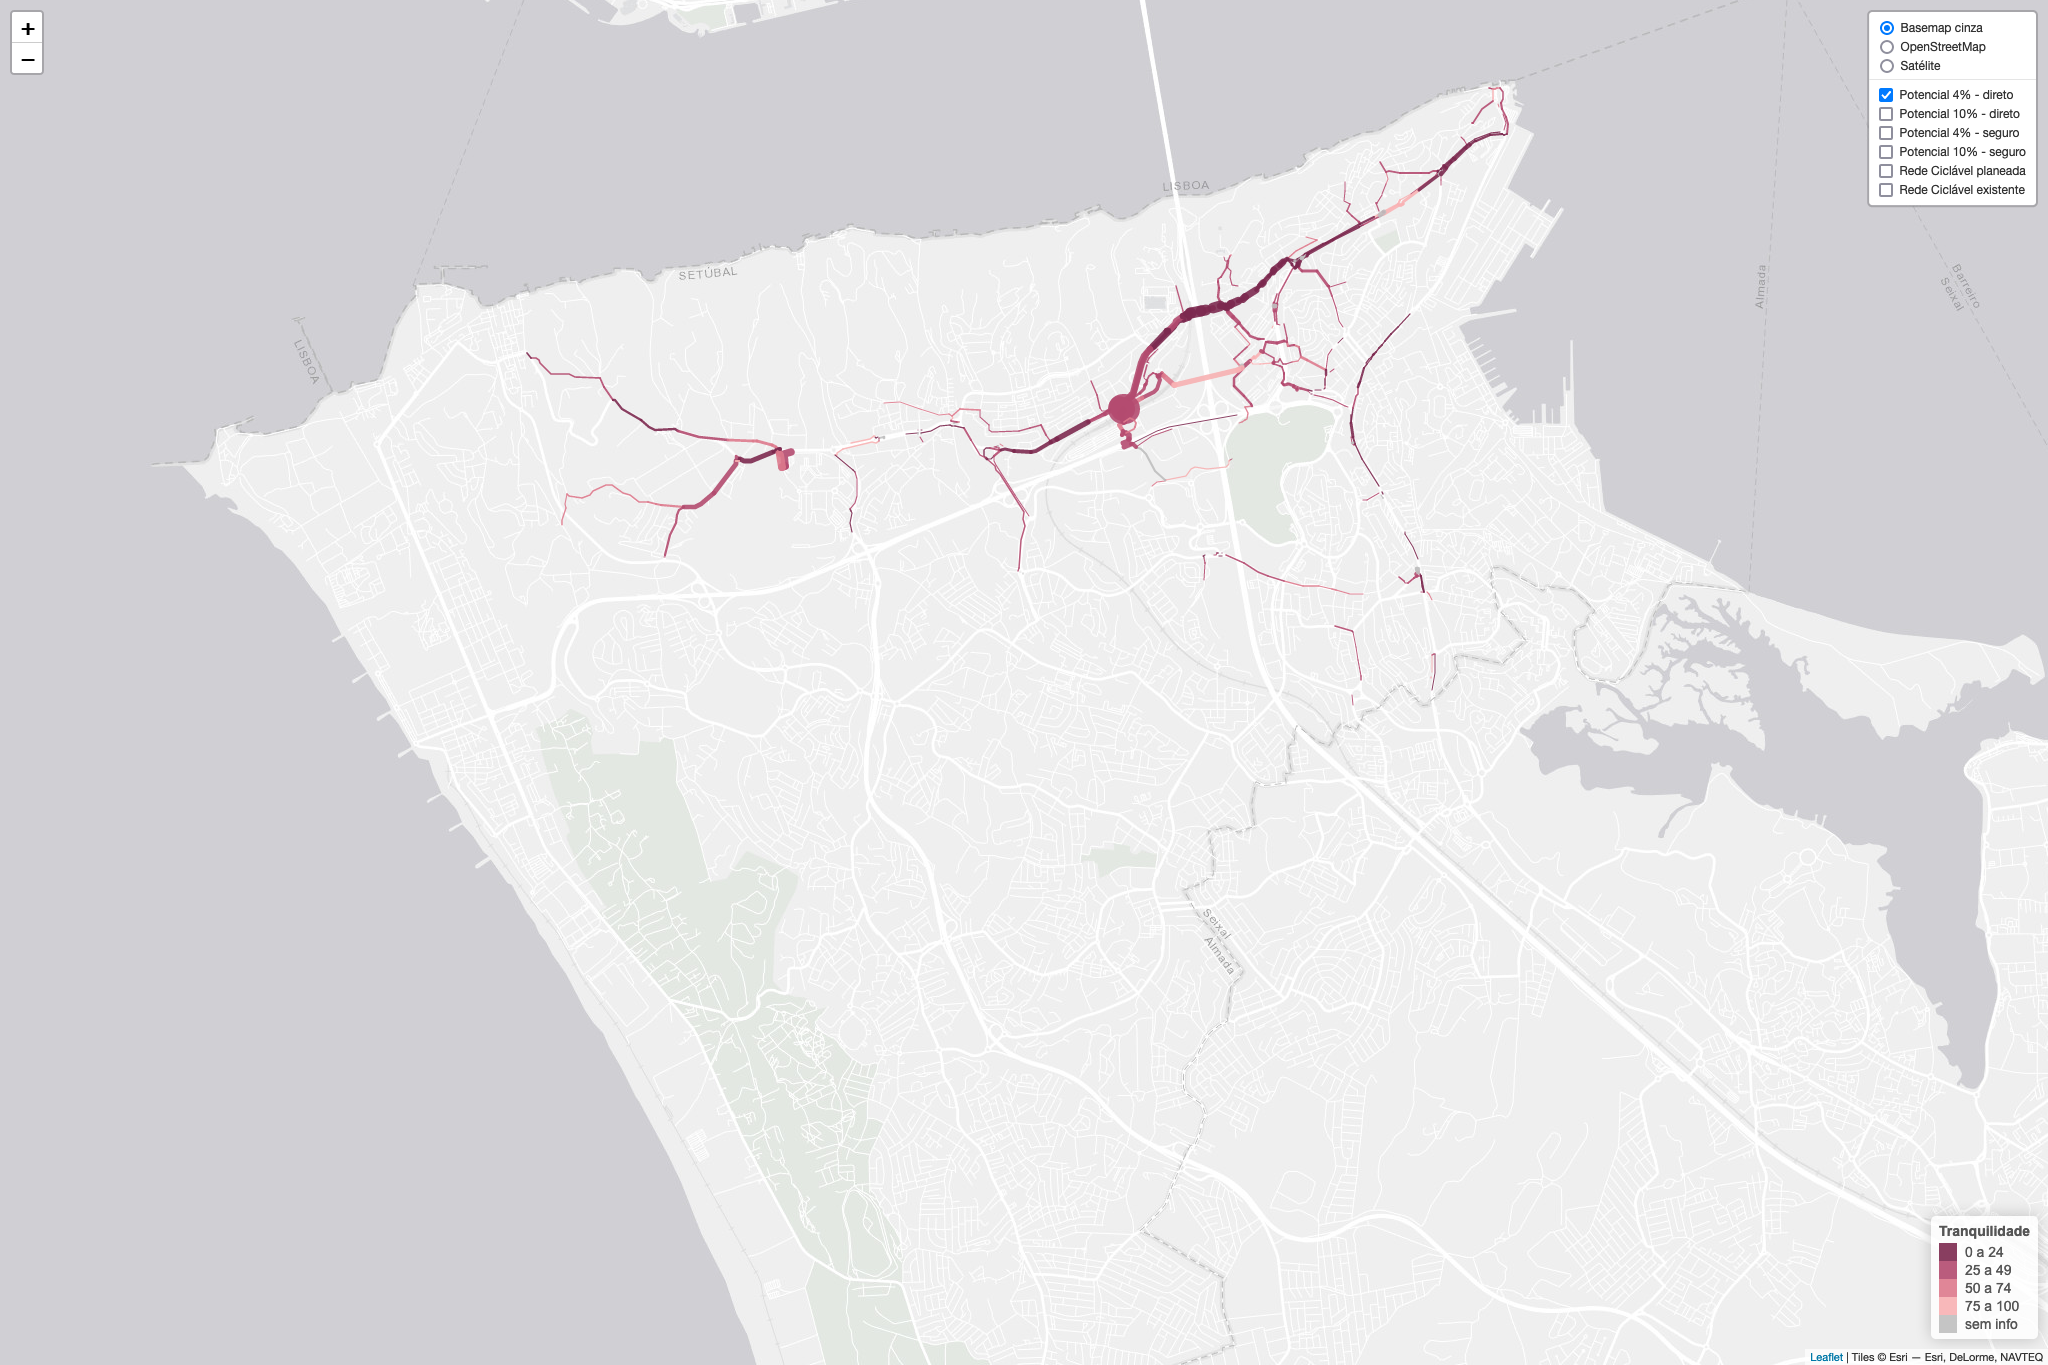
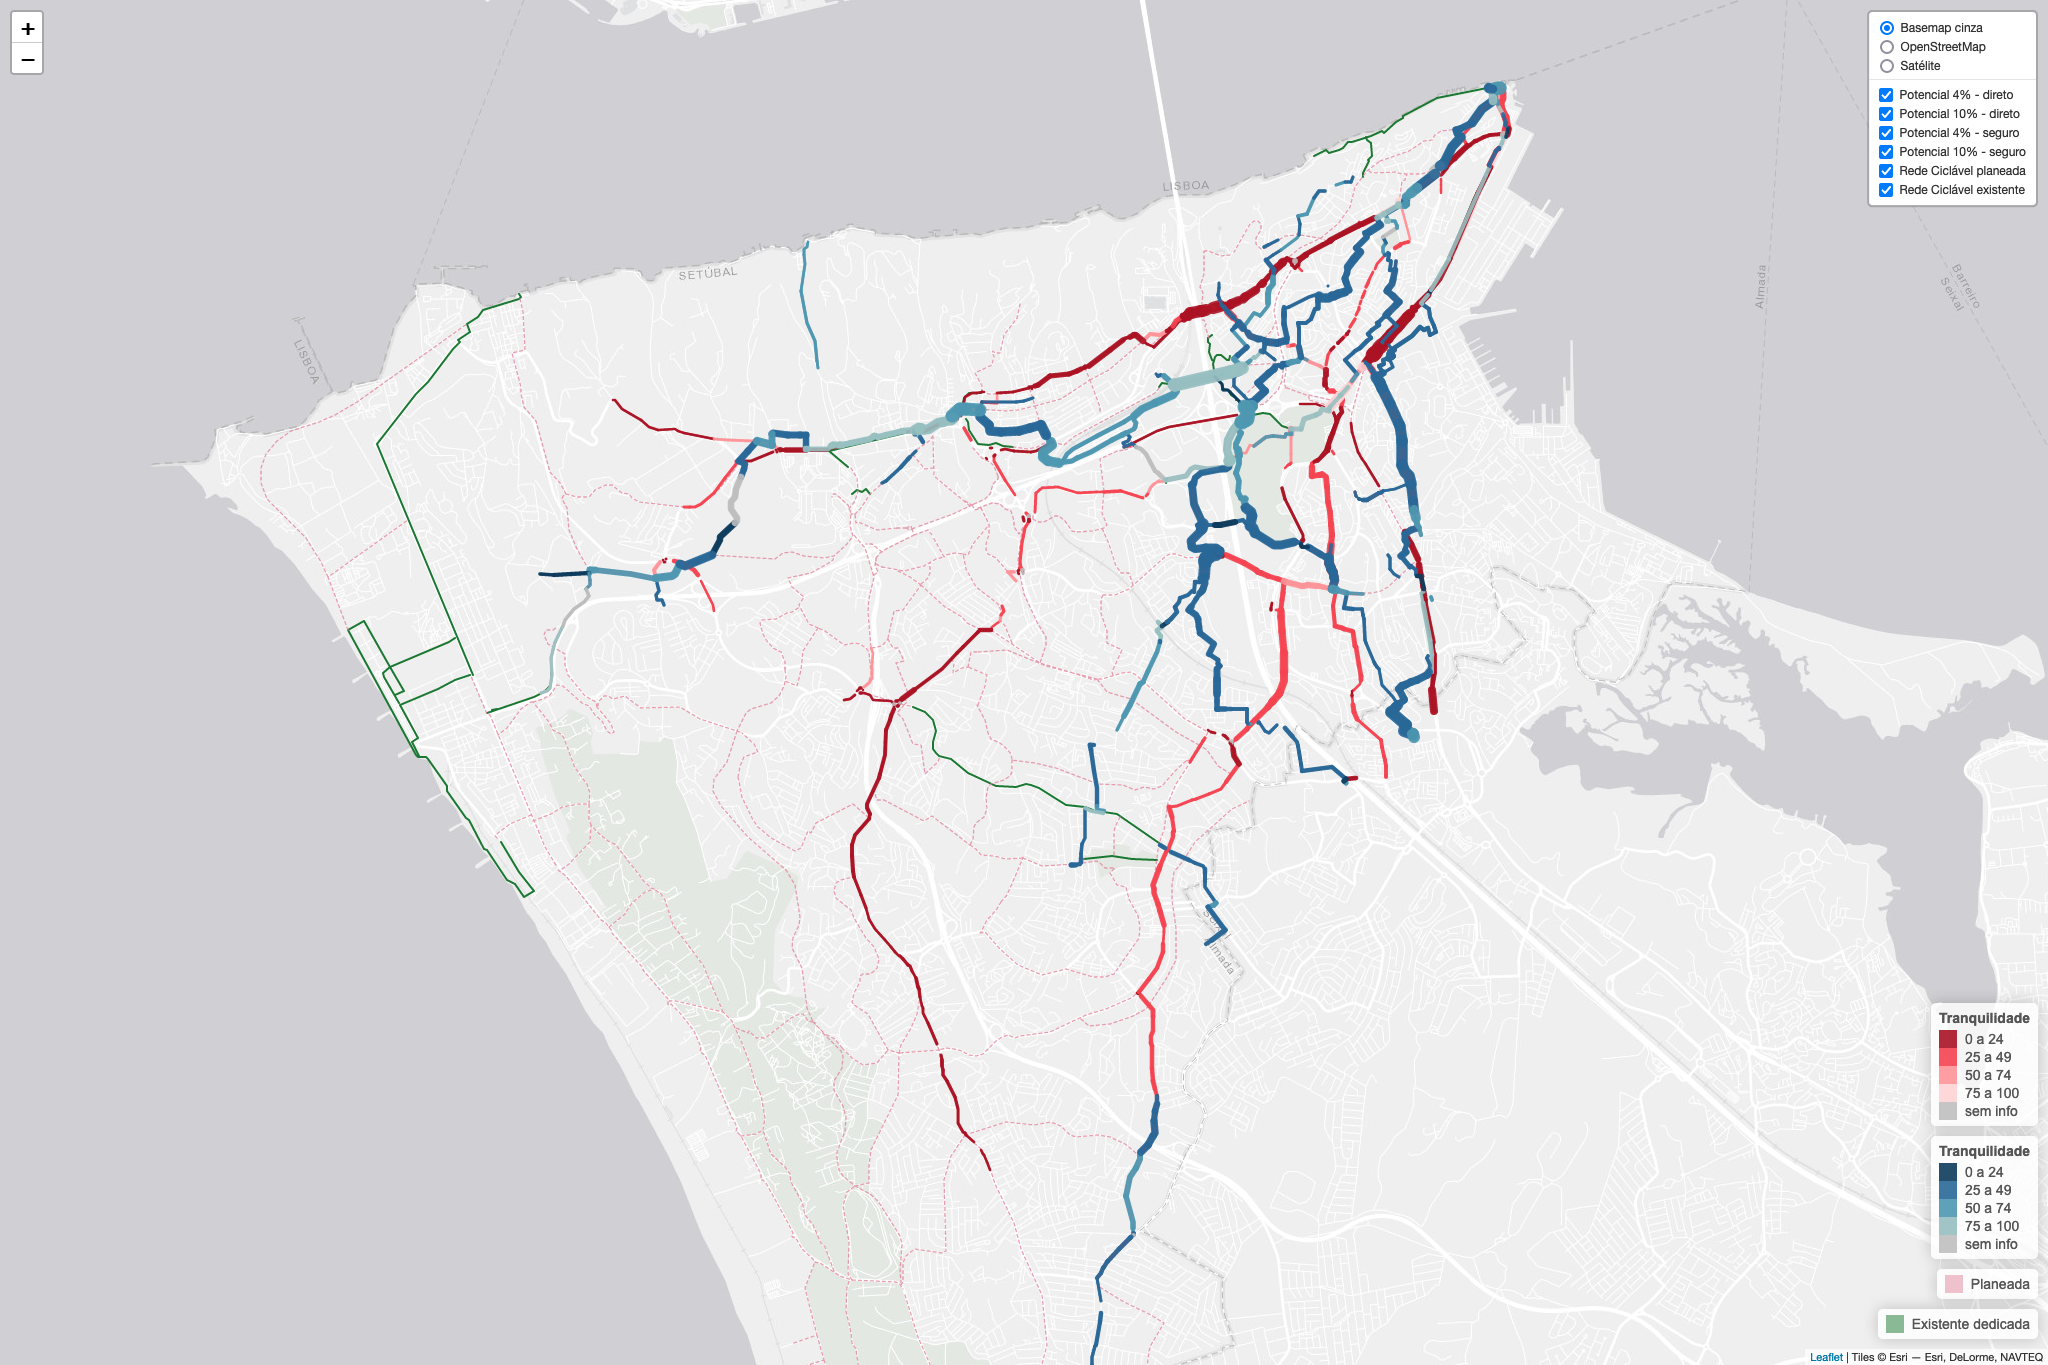
The biclaR maps present information for two types of routes: the most direct (but not necessarily the safest/quieter) or the safest/quietest (but not necessarily the most direct). On the maps, the The width of the lines shown varies depending on the number of potential cyclists for each goal (4% and 10%), and the The color of these same lines depends on the level of tranquility (quietness), the darkest ones being the least safe for cycling. Thus, the darker and wider segments are in need of intervention to become safer and potentially attract more cyclists. Note that the maps show suggested routes taking into account existing road infrastructure, and there may be other solutions to consider when planning cycling networks, such as building a bridge or underpass, or opening up a non-existent path through a garden.
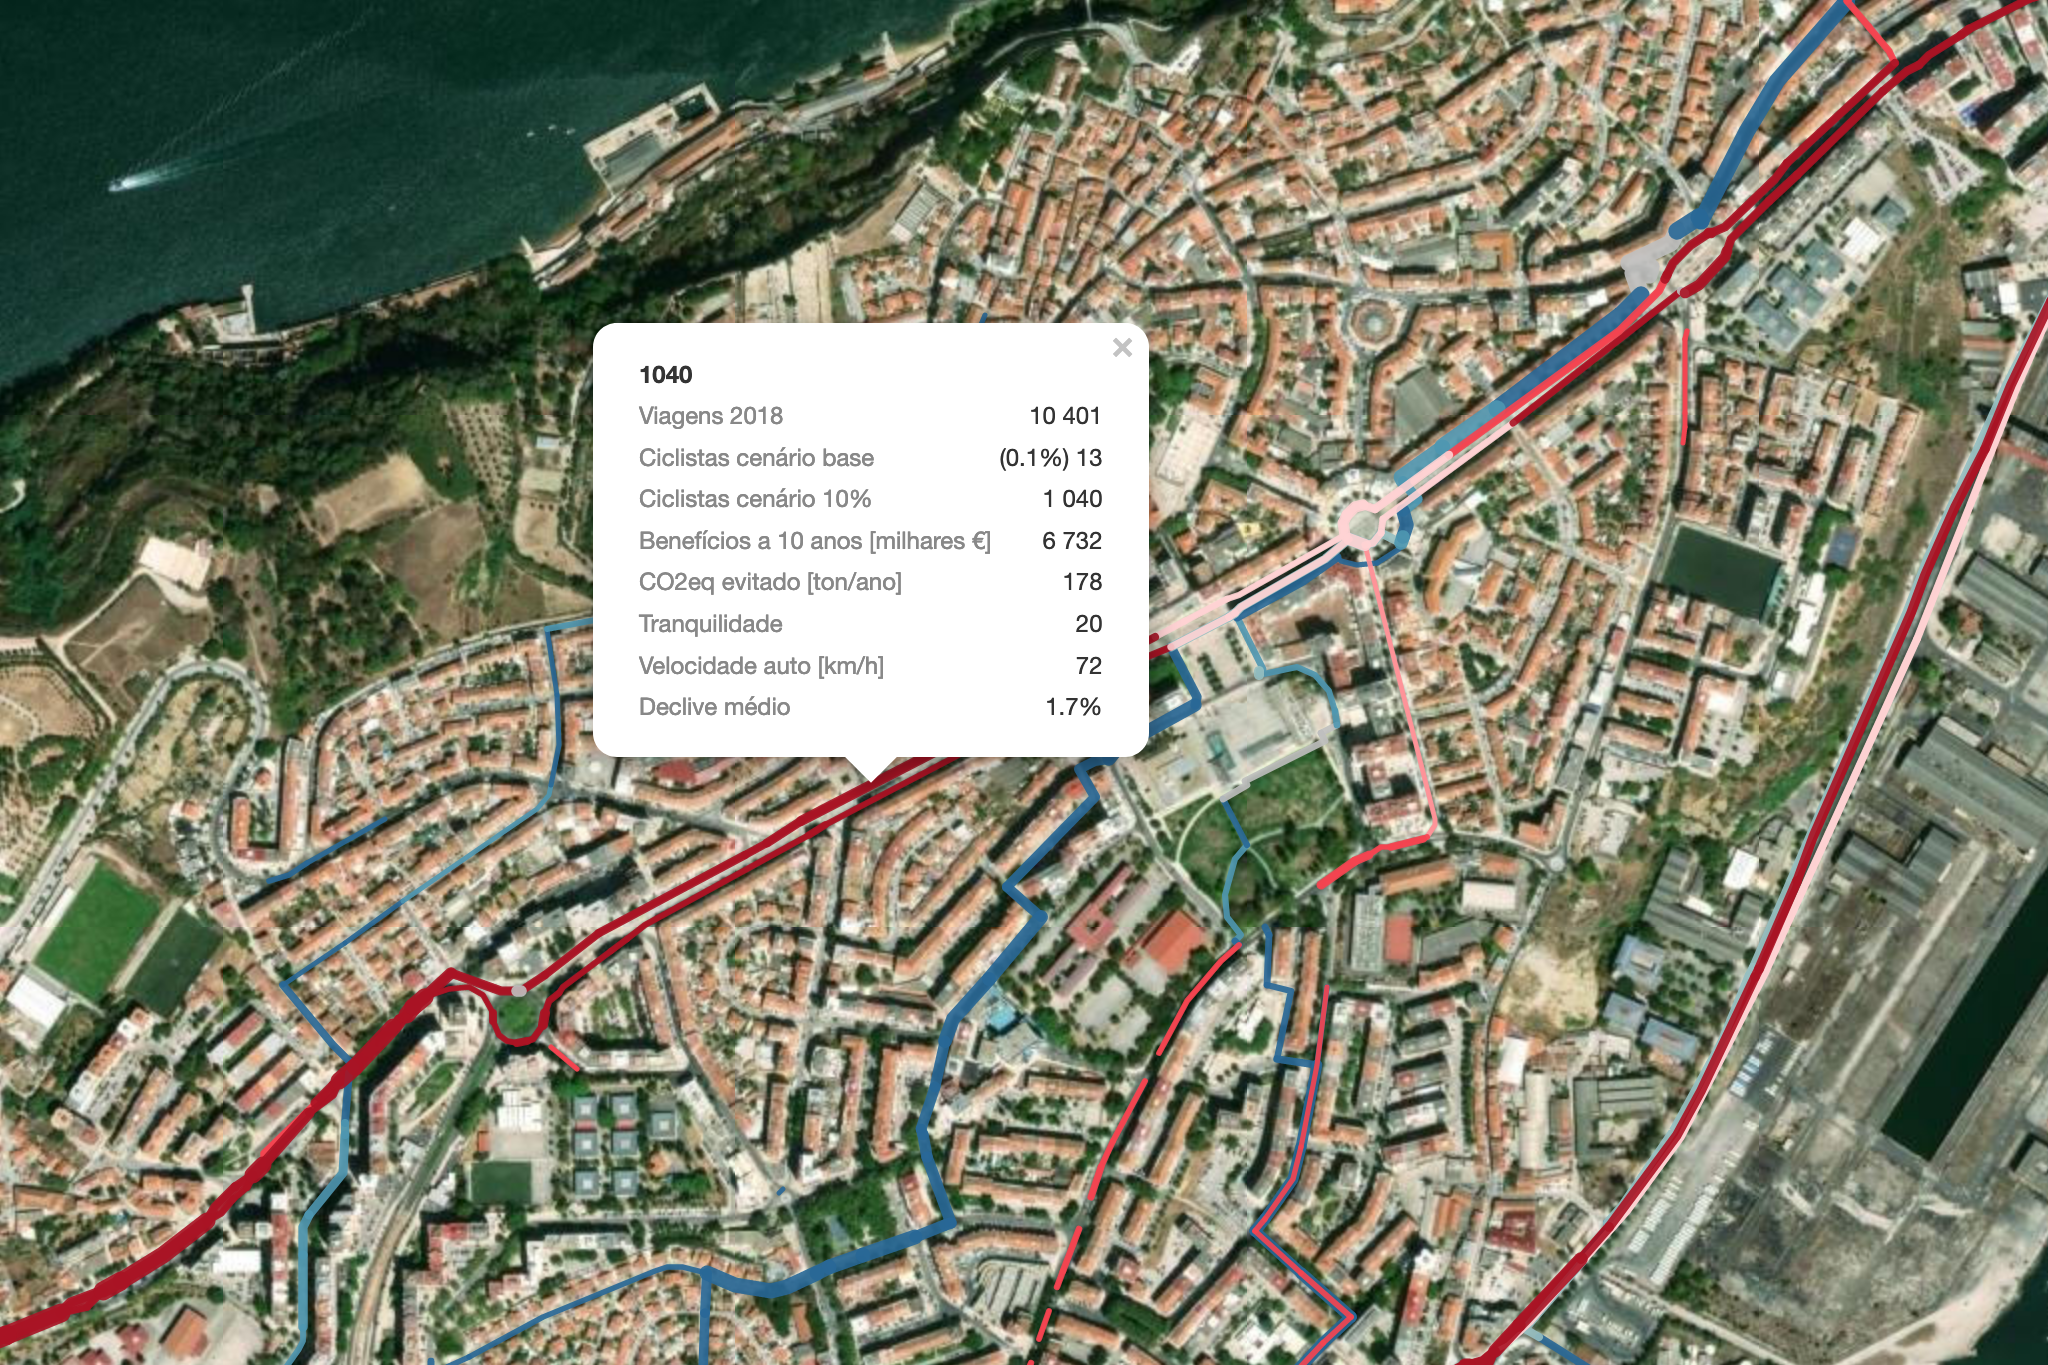
For each scenario, you can also see in aggregate what the estimated potential benefit is, in tons of CO2eq avoided annually, and in social benefits.
You can explore the potential networks of the entire amL and the different municipalities here:
It is important to note that the biclaR is not a predictive tool, nor a demand studyIt does not indicate any estimate of the modal shift probability for the bicycle. The biclaR merely presents, through an algorithm configured with certain variables, cycling potential results for different scenariosshowing more direct or quieter routes depending on the modal share ambition for the bicycle (4% or 10%). tool that, given a certain objective (scenario) that we want to achieve (for example, betting on the electric bicycle for trips up to 10 km) helps us to identify how we can potentially reach that objective.
The biclaR can help municipalities to better plan their cycling networks, or even validate the plans they had previously made. It can also help municipalities when applying for European funds to build a cycling network, allowing them to support different options with data on the cycling potential of new users from the car mode and also the socio-environmental impact.
Municipalities (and, in fact, anyone) can use the data and maps from the biclaR through the tool's websiteor download them in GeoPackage (.gpkg) format, which can be read in any modern GIS. Free access software is recommended QGIS for reading, visualizing, and analyzing data in detail.
The entire biclaR tool is available in open source in a repository on GitHub allowing anyone with adequate knowledge to do the same kind of analysis for another city or inter-municipal community. You can consult below methodological report for more details about how this tool works.
The development of the biclaR started in 2022, as we reported at the time. The work began with a survey of the existing and planned networks of each municipality and with a systematization of the IMob information, followed by the definition of the scenarios to be studied, the selection of the algorithm to perform this analysis and the definition of the other indicators. All this effort was made together with representatives and technicians from the 18 municipalities in the Lisbon metropolitan area and with several public entities and associations.